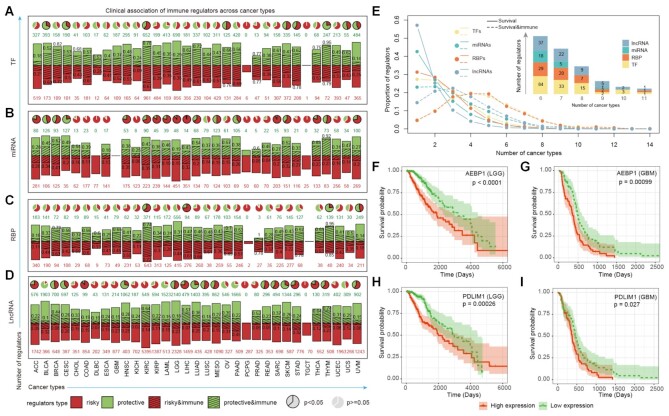
Figure 5.
The association between immunology regulons and clinical outcome. (A–D) The association between immunology regulons and survival-related genes (log-rank test, P-value < 0.05). Bar plots representing the numbers of protective genes (green bar; green number) and risky genes (red bar; red number) across cancers, with the shadows and black numbers showing the proportions of immune-related regulons. The pie plots above showing the proportion of protective genes to risky genes. Enrichment between survival-related genes and immunology regulons was evaluated using a hypergeometric test exactly. Significant results were labeled by the black frame of pie plots (P-value < 0.05). (A) for TFs; (B) for miRNAs; (C) for RBPs and (D) for lncRNAs. (E) Distribution of regulators occur in different number of cancers. The solid and dotted lines represent survival-related genes and the survival genes which were also enriched in immune pathways. The number of four types survival-related immunology regulons shared in multiple cancers were displayed in the bar plot above. (F–I) Kaplan–Meier plots for LGG (F and H) and GBM (G and I) patients classified by the median expression levels of AEBP1 (F and G) and PDLIM1 (H and I). The survival difference between clusters was calculated by log-rank test. Red line, high-expression group; green line, low-expression group.

