Figure 6.
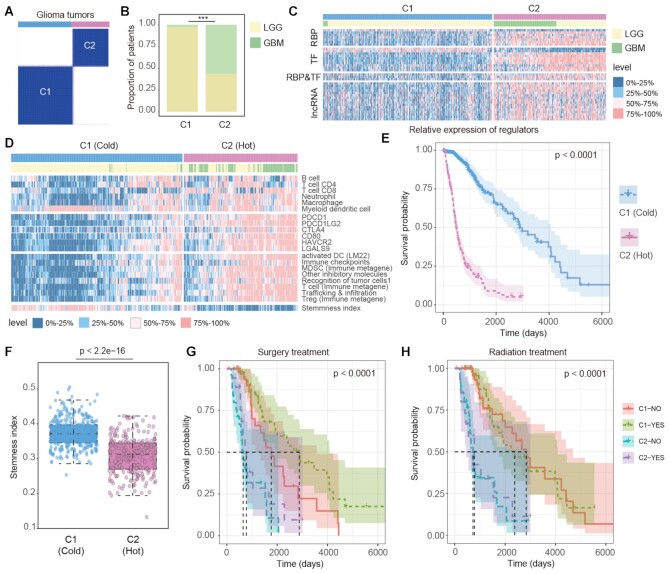
Immunology subtypes of glioma patients with distinct features. (A) The classification of glioma patients based on key regulons shared by LGG and GBM samples from TCGA. (B) The proportions of LGG and GBM samples in C1 and C2 subtypes. (C) The expression levels of key regulons in C1 and C2 subtypes. Annotation bars represent the sample subtypes and cancer types. The expression level was split into 0–25% quantile, 25–50% quantile, 50–75% quantile and 75–100% quantile. (D) The heat map showing the infiltration levels of 6 types of immune cell from TIMER, the expression of immune checkpoint genes and their ligands, the ssGSEA scores of eight immune-related signatures and the stemness indexes of samples. Annotation bars represent the sample subtypes and cancer types. (E) The Kaplan–Meier plot of glioma patients based classifications generated from consensus clustering. C2 patients showing a significantly poorer prognosis than C1 patients. (F) Distribution of stemness indexes of samples in C1 and C2 subtypes. P-value for two-sided Wilcoxon's rank-sum tests. (G–H) Kaplan–Meier plot of survival for LGG and GBM samples classified by the combinations of immunology subtypes and treatment states. The survival difference among clusters was calculated by log-rank test. (G) for surgery treatment; (H) for radiation treatment.

