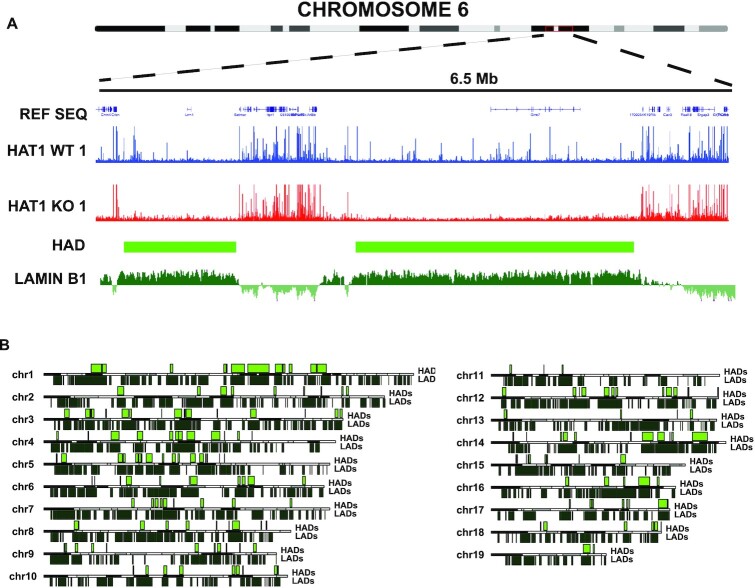
Figure 5.
HADs display a high degree of overlap with LADs. (A) Genome browser visualization of ATAC Seq data from HAT1+/+ (blue) and HAT1−/− (red) cell lines. For the indicated region of chromosome 6. Lamin B1 DamID data (dark green) from MEFs was obtained from the UCSC browser (73). (B) Karyoplots of each autosome with location of HADs on the top and LADs on the bottom.

