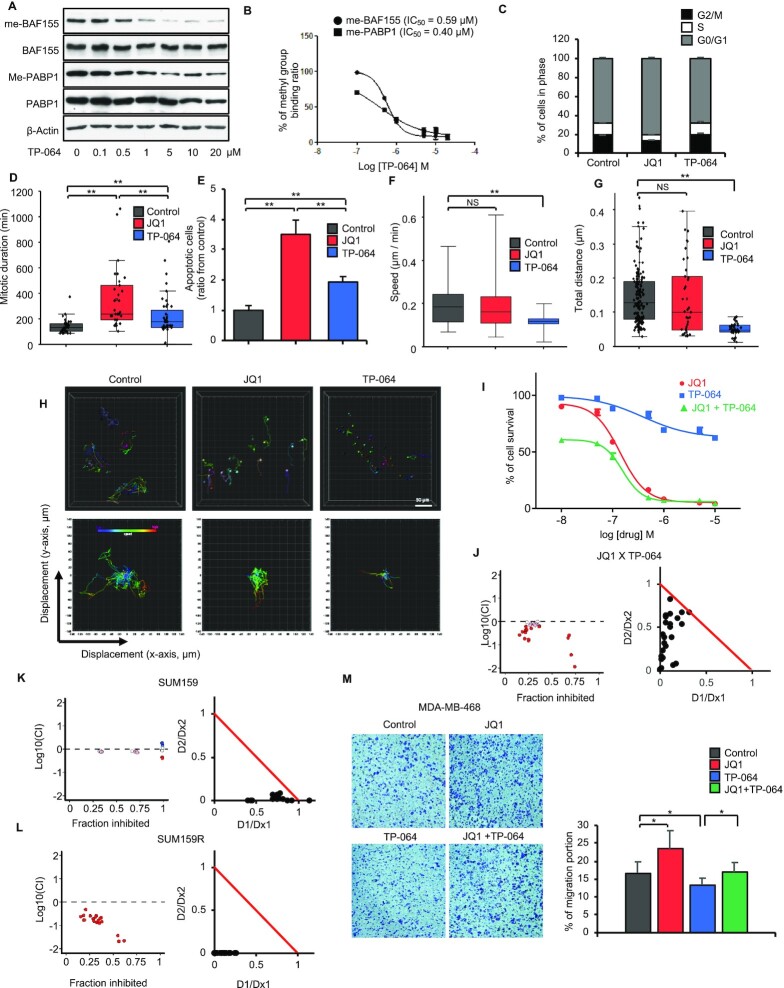
Figure 3.
TP-064 exhibits low cytotoxic effects, inhibits cell migration, and synergizes with JQ1 in triple-negative breast cancer cells. (A) Dose-dependent inhibition of CARM1-mediated methylation of BAF155 and PABP1 by TP-064. Total and methyl-specific BAF155 and PABP1 antibodies were used for immunoblotting of MDA-MB-468 total lysate. (B) Calculation of IC50 for TP-064 inhibited BAF155 and PABP1 methylation based on the band intensities in panel A. (C) MDA-MB-468 cell cycle analyses after treatment with vehicle, JQ1 or TP-064. (D) JQ1 but not TP-064 treatment increases mitotic duration. Average duration of mitosis was measured by time-lapse imaging after JQ1 or TP-064 treatment in H2B-RFP labeled MDA-MB-468 cells. Data are mean ± s.d. **P< 0.01, n = 33–42 cells. (E) Normalized apoptotic index by JQ1 or TP-064 in MDA-MB-468 cells. The number of apoptotic cells after treatment with JQ1 or TP-064 were normalized with those in vehicle treated condition. Data are mean ± s.d. **P< 0.01. (F) Average speed (μm/min) during cell migrations after treatment with JQ1 or TP-064 in H2B-RFP labelled MDA-MB-468 cells. Data are mean ± s.d. **P< 0.01; NS: not significant. (G) Average of distance (μm) of single cell migration over a 24-hour period after JQ1 or TP-064 treatment in MDA-MB-468 cells. Data are mean ± s.d. **P< 0.01; NS: not significant. (H) Representative images of single cell migration over time in control, JQ1, and TP-064 treated H2B-RFP expressing MDA-MB-468 cells (top) and plots of 2D displacements (bottom). (I) MDA-MB-468 cell viability in response to ascending doses of JQ1, TP-064 or JQ1 and TP-064 combination. (J–L) Synergistic growth inhibitory effect of JQ1 and TP-064 in MDA-MB-468 (J) and SUM159 (K) cells and CARM1 inhibits cell proliferation in SUM159R cells (L). Synergy was calculated by combination index (CI) based on enzyme kinetic models of Chou-Talalay for JQ1 and TP-064 combination (Supplementary Figure S3C and F). CI plot was represented by fraction inhibited (x-axis) and CI value substituted by log10 (y-axis). For normalized isobologram plot, CI scores are plotted by D1/Dx1 and D2/Dx2, where Dx1 (JQ1) and Dx2 (TP-064) are the doses of each single drug, causing fractional inhibition effect x, respectively. The red line indicates a boundary of additive effect. (M) Transwell cell migration assays after treating MDA-MB-468 cells with vehicle, JQ1, TP-064 or their combination. Migrated cells were stained with 1% crystal violet (left) and the percent of migrated cells under treatment of vehicle, JQ1, TP-064 or TP-064 plus JQ1 were plotted (right). Data are mean ± s.d. *P< 0.05.

