
Figure 13.
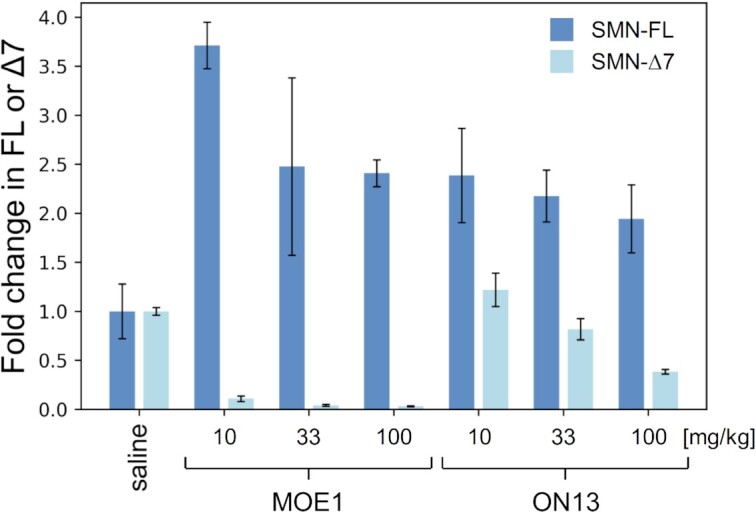
Quantification by ddPCR of the level of SMN transcript including exon 7 (SMN-fl) or excluding exon 7 (SMN-Δ7), after subcutaneous injection with ON13 or MOE1 at 10, 33 or 100 mg/kg, or with a saline solution (n= 3 for each cohort, all ddPCR experiment were performed in duplicate). The transcripts levels are reported as the average of the quantified values and the error bars represent the standard deviations. The transcript levels were normalized by taking the negative control cohort as reference.