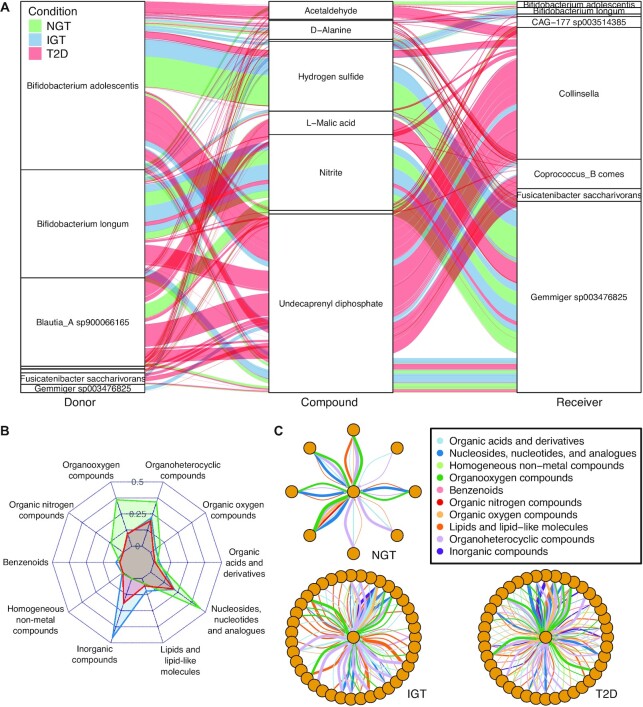
Figure 3.
SMETANA simulations uncover differences in metabolism across conditions. (A) Alluvial diagram showing top 10 compounds exchanged with statistical significance across conditions between eight species, representing 279 interactions (NGT n = 61, IGT n = 58, T2D n = 160) across 41 samples (NGT n = 12, IGT n = 12, T2D n = 17). Thickness of lines are proportional to magnitude of SMETANA score. (B) Radar plot of average SMETANA scores based on 543 interactions (NGT n = 50, IGT n = 161, T2D n = 249) across 18 samples (NGT n = 4, IGT n = 6, T2D n = 8) grouped by metabolite class across conditions for receiver Faecalibacterium prausnitzii C. (C) Network diagrams of interactions involving Faecalibacterium prausnitzii C (centered in each subgraph) as a receiver across conditions. Thickness of lines are proportional to magnitude of SMETANA score.

