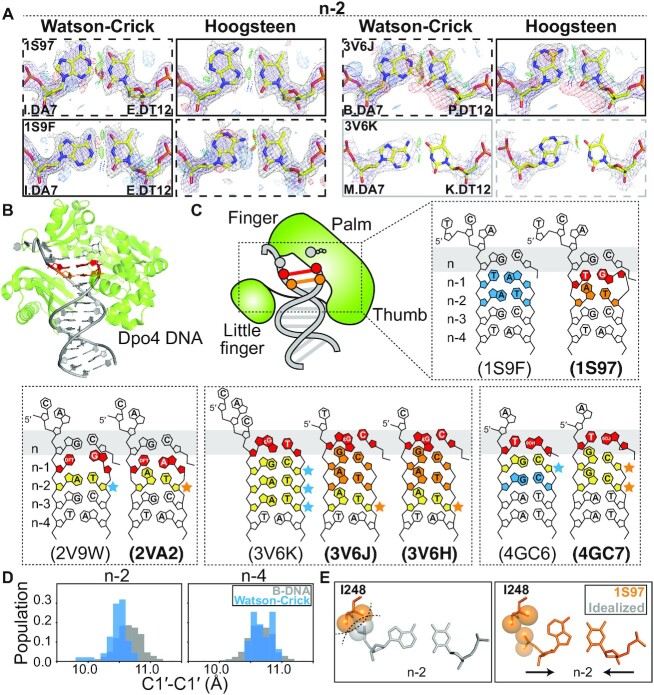
Figure 2.
Hoogsteen base pairs in Dpo4. (A) Comparison of 2mFo-DFc and mFo-DFc electron density maps calculated with models containing the original Watson–Crick (left) and Hoogsteen models (right). Electron density meshes and stereochemistry are as described in Figure 1C. The favored and less favored models are indicated using solid and dashed boxes, respectively. The boxes are in gray for ambiguous bps. A complete set of data is provided in Supplementary Figures S6, S7 and S9. (B) 3D structures of the protein–DNA complex showing the Hoogsteen bps. (C) Schematic showing the DNA (bolded PDB ID) containing Hoogsteen bps (in orange) and ambiguous Hoogsteen bps (in yellow next to orange stars). The corresponding structures (unbolded PDB ID) containing Watson–Crick bps (in sky blue) and ambiguous Watson–Crick bps (in yellow next to sky blue stars) are also shown inside the same dashed box. The lesions and mismatches were highlighted in red. (D) Distribution of C1′-C1′ distance between bases in bps at positions n-2 and n-4 in the Dpo4 DNA without lesions or mismatches (see PDB ID in Supplementary Table S8) (sky blue), showing constriction at n-2 compared to distribution of Watson–Crick bps in B-DNA (in gray) from Afek et al. (29). (E) Close up of the Hoogsteen bp in the active site of Dpo4, which are more compressed than idealized B-form DNA, thus avoiding potential steric clash between the DNA backbone at n-2 and Ile248.

