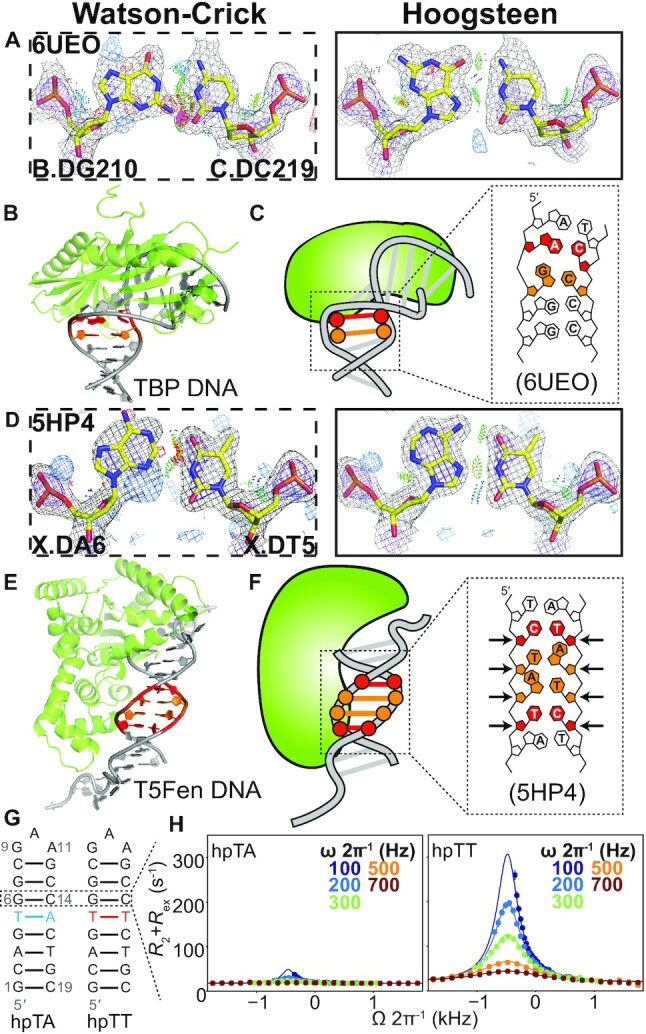
Figure 3.

Hoogsteen base pairs next to mismatches. (A andD) Comparison of 2mFo-DFc and mFo-DFc electron density maps for the Watson–Crick (left) and the corresponding Hoogsteen models (right) for (A) the G-C bp next to an A-C mismatch in TBP, and (D) the A-T bp next to a C-T mismatch in T5-flap endonuclease. Note that the G-C bp in (A) was modeled as a Hoogsteen bp in PDB 6UEO. Electron density meshes and stereochemistry are as described in Figure 1C and the box scheme is as described in Figure 2A. (B andE) 3D structures of the protein–DNA complex showing the Hoogsteen bps for (B) TBP and (E) T5-flap endonuclease. (C andF) Schematic showing the DNA containing Hoogsteen bps (in orange), as well as the mismatches (in red) for (C) TBP and (F) T5-flap endonuclease. (G) Hairpin DNA with and without mismatch used in NMR measurements. Hoogsteen populations were measured at G6-C14 bp. (H) NMR off-resonance R1ρ profiles of G6-C8. Spin-lock powers are color coded. Error bars were estimated using a Monte-Carlo scheme and are smaller than data points (Materials and Methods).
