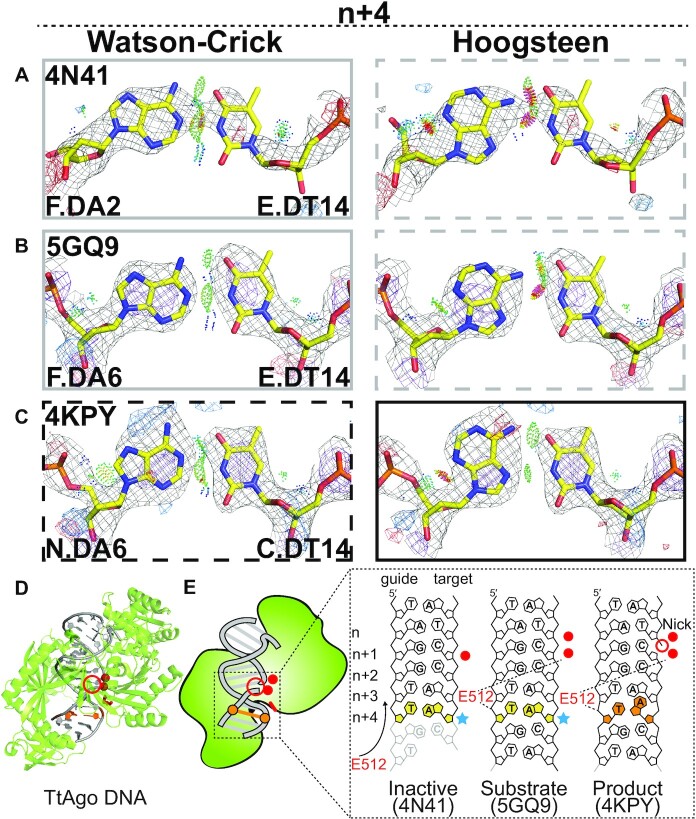
Figure 5.
Hoogsteen base pairs in TtAgo. (A–C) Comparison of 2mFo-DFc and mFo-DFc electron density maps for the original Watson–Crick (left) and the corresponding Hoogsteen models for the A-T bp at position n+ 4 in (A) an inactive substrate complex with a 15-mer target DNA, (B) an active substrate complex with a 16-mer target DNA, (C) a product complex with a 19-mer target DNA with a nick between positions n and n+1. Electron density meshes and stereochemistry are as described in Figure 1C and the box scheme, as in Figure 2A. A complete set of data for other bps and structures is provided in Supplementary Figure S7. (D) 3D structures of the protein-DNA complex showing the Hoogsteen bps. (E) Schematic showing the DNA containing Hoogsteen bps (in orange), ambiguous Watson–Crick bps (in yellow next to sky blue stars), as well as the E512 (in red). Also shown is the nick (red unfilled circle) and metal ions (red filled circle). Disordered DNA regions were denoted with transparency.

