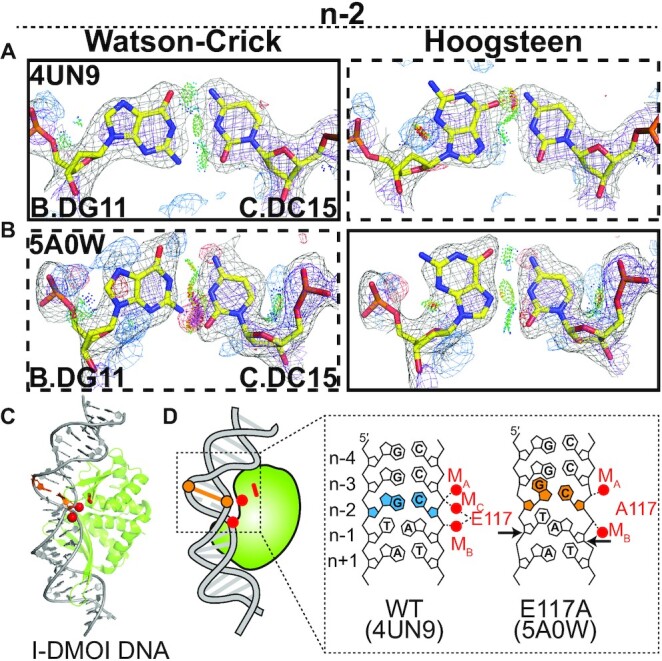
Figure 6.

Hoogsteen base pairs in I-DMOI endonuclease. (A and B) Comparison of 2mFo-DFc and mFo-DFc electron density maps for the original Watson–Crick (left) and the corresponding Hoogsteen models (right) for the G-C bp at position n-2 in (A) a wild-type substrate complex, (B) the E117A mutant substrate complex. Electron density meshes and stereochemistry are as described in Figure 1C and the box scheme is as described in Figure 2A. (C) 3D structures of the protein–DNA complex showing the Hoogsteen bps. (D) Schematic showing the DNA containing Hoogsteen bps (in orange), Watson–Crick bps (in sky blue), as well as the E117/A117 (in red). Also shown are the metal ions (red filled circle).
