Figure 7.

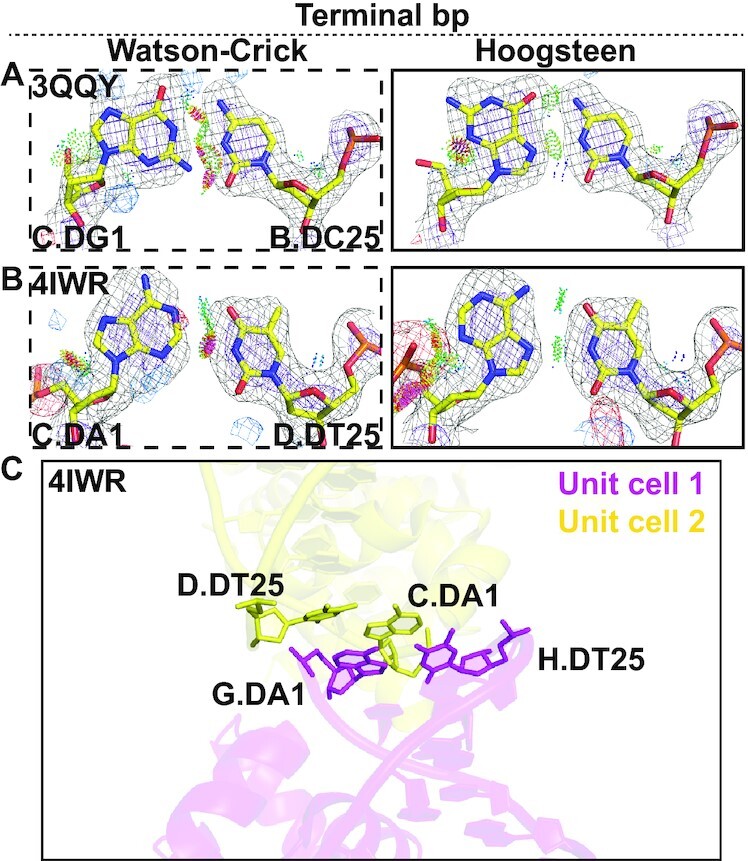
Terminal Hoogsteen base pairs. (A and B) Comparison of 2mFo-DFc and mFo-DFc electron density maps for the Watson–Crick (left) and the corresponding Hoogsteen models (right) for (A) a G-C terminal bp in Homing endonuclease I-Onul and (B) a A-T terminal bp in Esp1396I. Electron density meshes and stereochemistry are as described in Figure 1C and the box scheme is as described in Figure 2A. A complete set of data is provided in Supplementary Figures S6 and S7. (C) An example of crystal stacking interactions in a terminal Hoogsteen bp.
