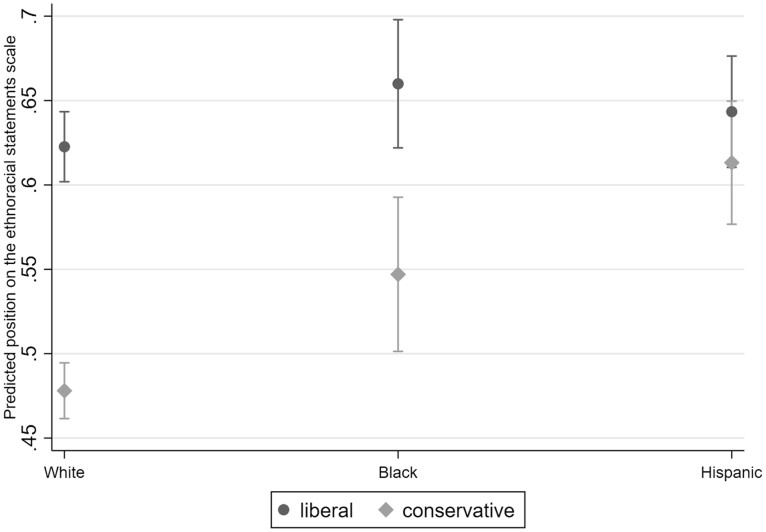
Figure 3.
Marginal effects of ethnoracial identity on the ethnoracial statements scale, by ideology. Figure presents the marginal effects (and 95 percent confidence intervals) of a respondent’s ethnoracial group—dependent on their ideology—on the ethnoracial statements scale. Effects estimated from Model 2 of Supplementary Material table SM.3, which interacts the ideology and ethnoracial variables.

