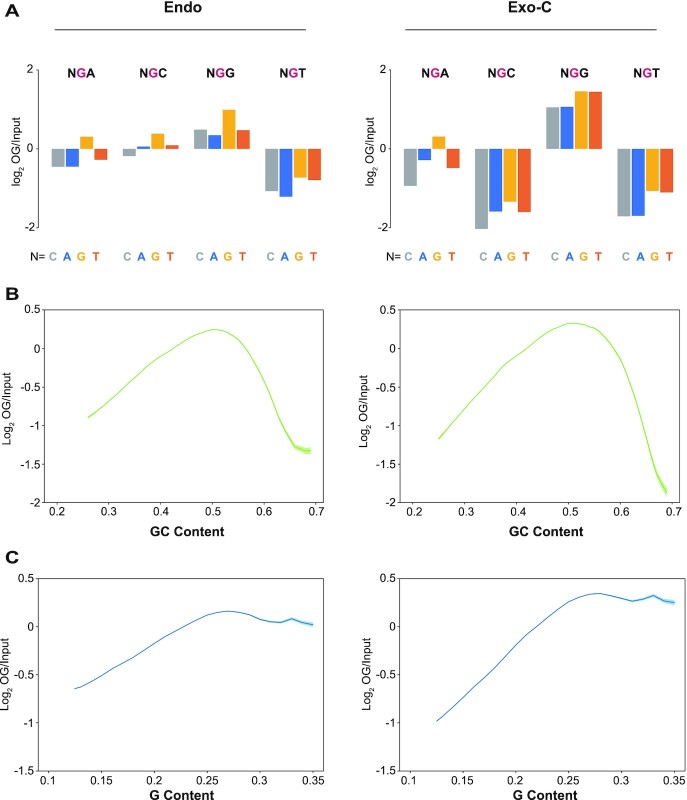
Figure 2.
Local sequence context of OGs. (A) The relative frequencies (log2 OG/Input) of all 16 tri-nucleotides having a central OG (for CLAPS-seq) or G (for input). (B, C) The relationship between normalized OG signal and (B) GC content in double strands or (C) G content in single strand. The shadow represents mean ± S.E.M. Replicates 1 of endogenous (left panels) and exogenous-cellular samples (right panels) are shown.

