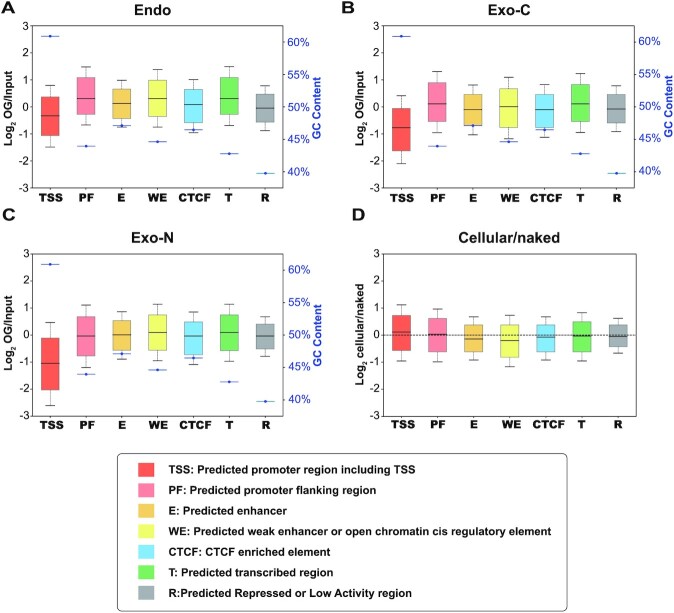
Figure 3.
OG distribution across different chromatin states. (A–C) Relative OG levels and corresponding GC contents (blue) of 7 chromatin states in (A) Endo, (B) Exo-C and (C) Exo-N samples. Replicates 1 are shown. (D) The ratios of Exo-C OGs to Exo-N OGs in seven chromatin states. Biological replicates of each condition were combined for analysis.

