Figure 4.

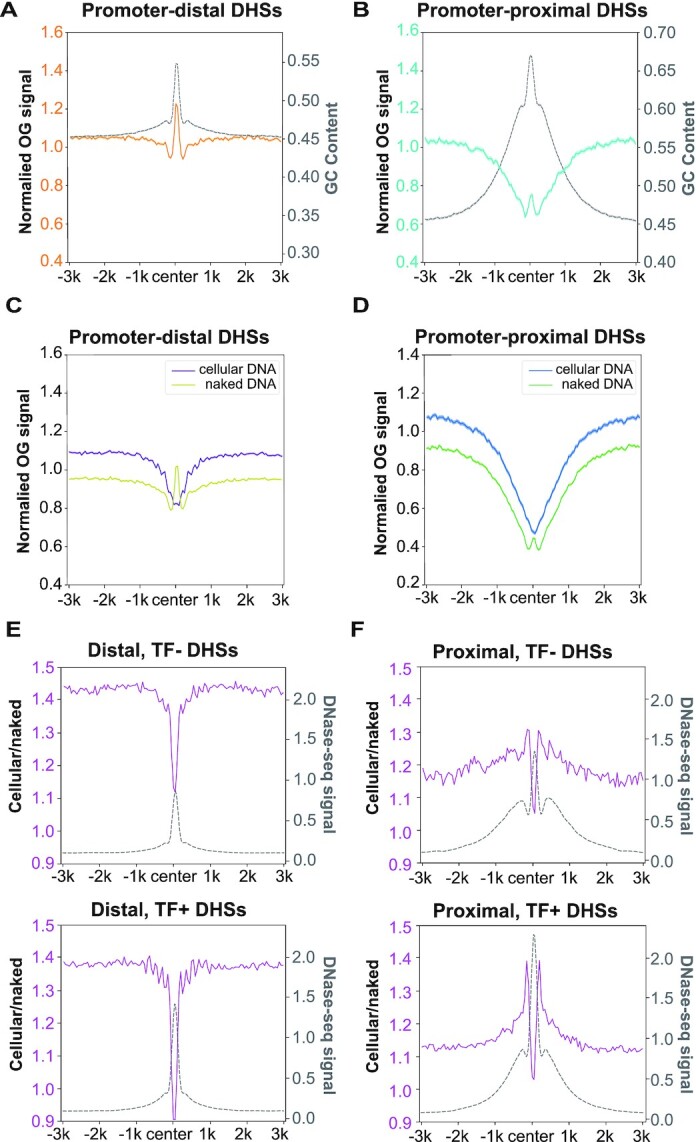
The influence of genome accessibility on OG distribution. (A, B) Relative OG levels of endogenous OGs centred in (A) promoter-distal DHSs (n = 69 327) and (B) promoter-proximal DHSs (n = 26 391) were plotted alongside the corresponding GC contents (gray). (C, D) Relative OG levels of Exo-C and Exo-N samples centred in (C) promoter-distal DHSs and (D) promoter-proximal DHSs. For A–D, replicates 1 are shown and the shadow represents mean ± S.E.M. (E, F) The ratios of Exo-C OGs to Exo-N OGs centred in (E) promoter-distal DHSs and (F) promoter-proximal DHSs alongside the relative DNase-seq signals (gray). Top panels (TF–): DHSs non-overlapped with 109 ENCODE-mapped TFBS (n = 31 253 for distal, n = 6527 for proximal); bottom panels (TF+): DHSs overlapped with 109 ENCODE-mapped TFBS (n = 38 074 for distal, n = 19 864 for proximal). For E and F, biological replicates of each condition were combined for analysis.
