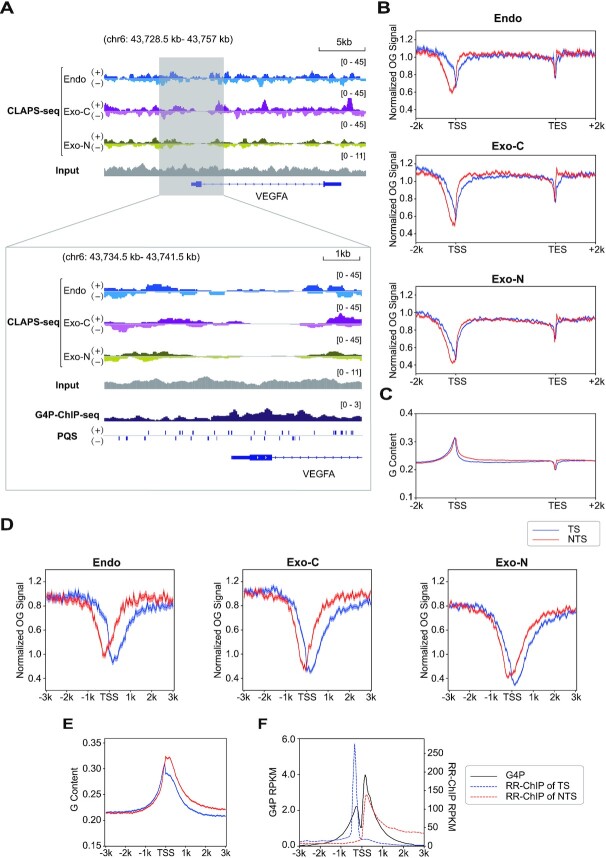
Figure 5.
OG distribution along genes. (A) Top panel, genome browser screenshots of strand-specific OG distributions around the VEGFA gene. Bottom panel, zoomed-in screenshots of OG distributions in the TSS surrounding region alongside G4P peaks and PQSs. Replicates 1 are presented. The G4 distribution measured by G4P-ChIP-seq and strand-specific PQS data were obtained from (32). (B) Metaprofiles of OGs on both strands of all analyzed genes and 2 kb upstream and downstream. Replicates 1 are presented. (C) G content profile of both strands over the same gene loci. (D) Metaprofiles of OGs of both strands around TSSs. Results from replicates 1 are presented. (E) G content profile of both strands around TSSs. For B–E, TS: template strand (blue); NTS: non-template strand (red). The shadow represents mean ± S.E.M. (F) G4P-ChIP-seq (black) (32) and RR-ChIP-seq (blue and red for two strands) (31) signals around TSSs. RR-ChIP-seq mapped the RNA strands of R-loops.

