Figure 6.
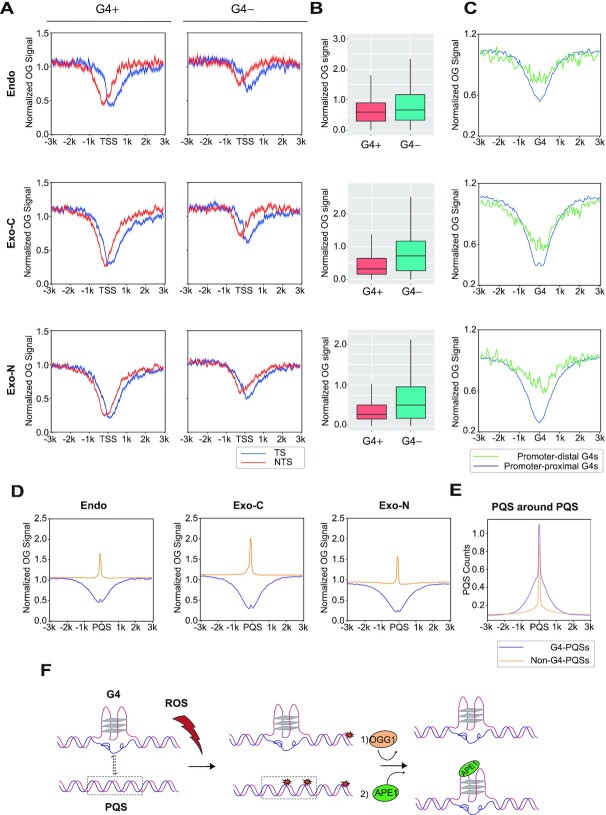
G4 structure reduces OG occurrence. (A) Metaprofiles of OG around TSSs with G4P peaks (G4+, n = 7173) and without G4P peaks (G4–, n = 7140). The shadow represents mean ± S.E.M. (B) Quantification of OGs in G4+ and G4– TSS surrounding regions (±500 bp). Endo, P value < 2.2e–88; Exo-C, P value < 3.5e–251; Exo-N, P value < 5.0e–228. (C) Normalized OG signals around promoter-proximal G4P peaks (n = 12 311) and promoter-distal G4P peaks (n = 5476). (D) OG distributions around PQSs within G4P peaks (G4-PQSs, n = 31 623) and out of G4P peaks (non-G4-PQSs, n = 1 474 730). Replicates 1 are presented for A–D. (E) The profiles of PQSs around G4-PQSs and non-G4-PQSs. (F) The model illustrating the relationship between OG formation and G4 regulation. G4s can prevent OG formation to protect genome stability. On the other hand, non-G4-PQSs are hotspots of OGs which can stimulate the transformation of duplex to G4 and regulate downstream transcription through OGG1 and APE1.

