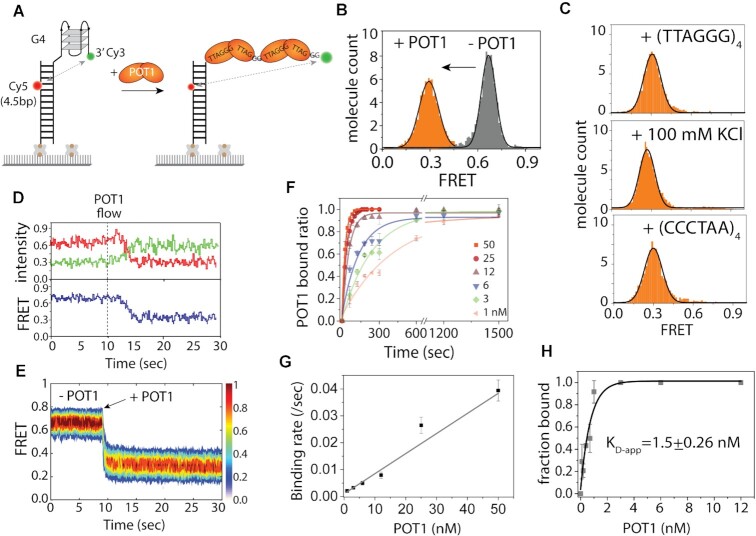
Figure 1.
POT1 is stably bound to telomeric G4/4R. (A) Schematic smFRET model of before and after POT1 (two orange lobes represent OB1 and OB2 domains of a single POT1 molecule) binding to telomeric G4/4R DNA (Top4.5 construct). (B) The FRET histograms of 4R before and after POT1 (25 nM) binding. In y-axis, molecule count means the normalized number of molecules. (C) FRET histograms after 30 min incubation with 4R only (top), 100 mM KCl (center) and C4 (bottom) to the POT1 bound G4. (D) The representative real-time smFRET trace of POT1 binding to 4R (protein flow at ∼10 s). (E) The heatmap (n > 100), generated by synchronizing the POT1 bound state. (F) Single-exponential fitting of POT1 bound fraction to 4R overhang at different POT1 concentrations. (G) Linearly fitted binding rate represents the corresponding POT1 binding rate to 4R overhang at different concentration. (H) Determination of the apparent dissociation constant (KD-app) of POT1 to 4R/G4.

