Figure 2.
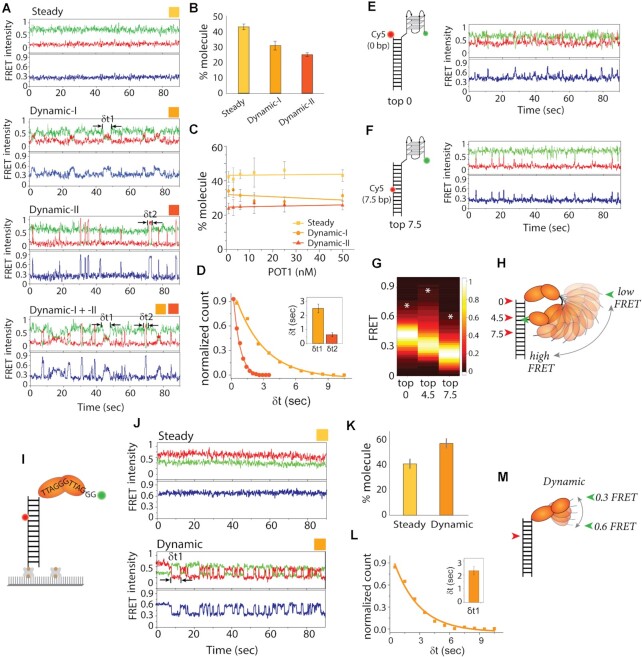
POT1 bound telomeric overhang shows dynamics. (A) The representative smFRET traces of POT1 bound to telomeric 4R after wash of free protein show steady (FRET ∼0.3, top), Dynamic-I (FRET ∼0.2–0.6, second from top), and Dynamic-II (FRET ∼0.2–0.9, bottom two) traces. (B, C) Quantification of molecular behavior of POT1 bound G4 (steady versus two types of dynamic) at 25 nM after wash of free protein (B) and the protein concentrations ranging from 50 to 1 nM before wash of free protein (C). (D) Dwell time of dynamic FRET traces, δt1 for Dynamic-I and δt2 for Dynamic–II respectively. (E, F) Model cartoon of Top0 (E) and Top7.5 (F) 4R construct, based on the acceptor dye position from the top of the duplex and beside the representative POT1 bound smFRET traces respectively. (G) FRET heatmap histogram of three constructs generated from the dynamic traces (keeping the bin size 0.2). White asterisk denotes level of highest FRET values observed in traces. (H) Schematic dynamic model of POT1 bound telomeric G4/4R overhang. (I) Schematic smFRET model of monomer POT1 bound to telomere overhang. (J) The representative smFRET steady (top) and dynamic (bottom) traces of POT1 bound to telomeric 2R overhang. (K) Quantification of molecular behavior of POT1 bound 2R (steady vs dynamic). (L) Dwell time (δt1) of dynamic FRET traces of 2R overhang. (M) Schematic dynamic model of POT1 bound telomeric 2R overhang.

