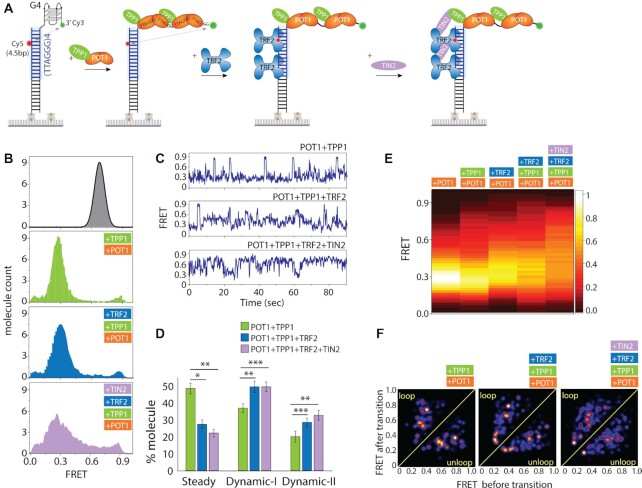
Figure 6.
TPP1 and TIN2 generates smaller substeps within the TRF2-POT1 induced movement. (A) Experimental schematics of four shelterin components added in succession to telomeric duplex (four repeats of TTAGGG tract) with G4/4R overhang. First, premixed POT1–TPP1 is applied followed by TRF2 and TIN2 which interact with TRF2 and TPP1. (B) FRET histogram of telomeric duplex with 4R (top), with POT1-TPP1 (second from top), with TRF2 (third from top) and TIN2 bound condition (bottom). (C) Representative smFRET traces. (D) Quantification of steady and dynamic patterns. All statistics for this figure are calculated using a two-tailed two-sample Student's t test (*P < 0.05; **P < 0.01, ***P < 0.001). (E) FRET heatmap histograms generated from the dynamic traces. (F) Transition density plot (TDP) of the corresponding protein conditions.

