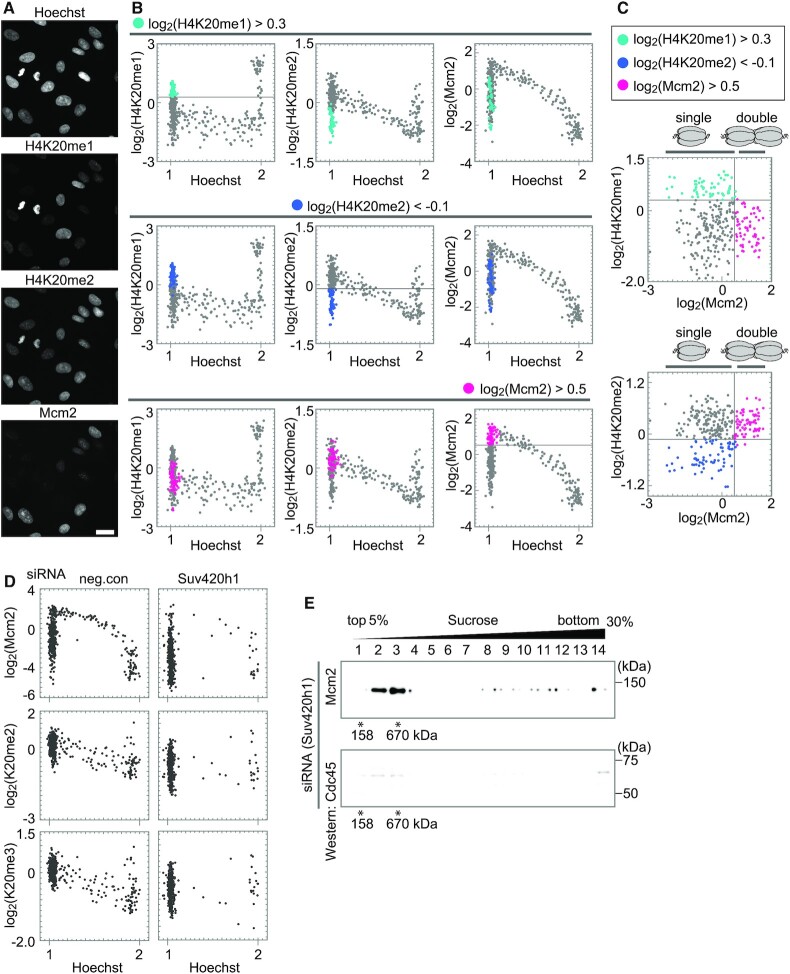
Figure 6.
Relationship between histone H4K20 methylation levels and MCM hexamer states. (A) Representative microscopic images of Hoechst, H4K20me1, H4K20me2, and Mcm2. Scale bar, 20 μm. (B) Single-cell plot analysis of H4K20me1, H4K20me2, and Mcm2. The G1 cells with high levels of H4K20me1 (Hoechst < 1.125 and log2(H4K20me1) > 0.3) are shown in light blue in the upper panel, those with low levels of H4K20me2 (Hoechst < 1.125 and log2(H4K20me2) < −0.1) in blue in the middle panel, and those with high levels of Mcm2 (Hoechst < 1.125 and log2(Mcm2) > 0.5) in pink in the lower panel. (C) Scatterplots between H4K20me1 and Mcm2 intensities, and between H4K20me2 and Mcm2 intensities based on (B). (D) Single-cell plot analysis of Mcm2, H4K20me2, and H4K20me3 in cells treated with either control-siRNA, or Suv420h1-siRNA. The number of cells examined in each panel is 450. (E) Western blot analysis using anti-Mcm2 (upper) and anti-Cdc45 (lower) antibodies following fractionation with a linear 5–30% sucrose gradient. The cells treated with Suv420h1-siRNA were used.

