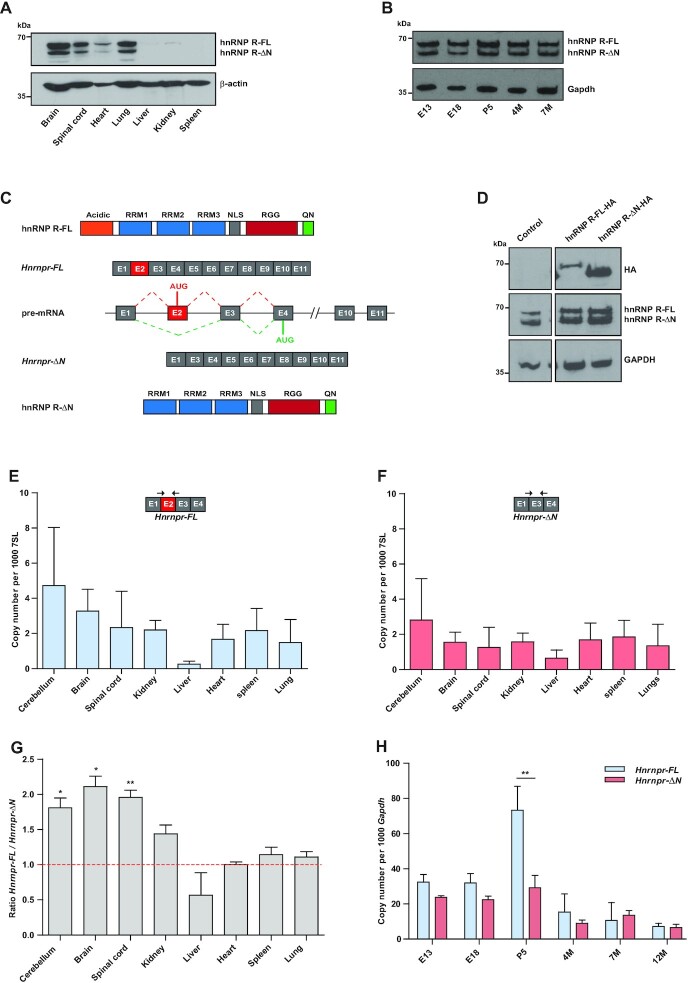
Figure 1.
The Hnrnpr gene encodes two hnRNP R protein isoforms generated by alternative splicing. (A) Western blot analysis of hnRNP R isoforms using a C-terminal-specific antibody performed on tissue lysates from P5 wildtype mice. Equal protein loading in individual lanes was verified by probing with an antibody against β-Actin. (B) Western blot analysis of hnRNP R on brain lysates prepared from wildtype mice of different ages using the C-terminal-specific hnRNP R antibody. Equal protein loading in individual lanes was verified by probing with an antibody against Gapdh. (C) Schematic representation of the murine Hnrnpr locus that gives rise to a full-length Hnrnpr-FL mRNA and an exon 2-skipped Hnrnpr-ΔN mRNA produced by alternative splicing. Full‐length hnRNP R-FL and N‐terminally truncated hnRNP R-ΔN isoforms are shown. Protein domains are depicted as colored boxes: RRM (RNA-Recognition Motif), NLS (Nuclear Localization Signal), RGG (Arg-Gly-Gly box), and Q/N (Gln/Asn-rich domain). Constitutive exons are represented by gray boxes. Exon 2 (red box) is alternatively spliced. Introns are represented by horizontal lines. (D) Western blot analysis of lysates from HEK293TN cells transfected with plasmid constructs for expression of HA-tagged hnRNP R-FL and hnRNP R-ΔN. Total lysates were derived from HEK293TN cells 48 h after transfection with the indicated plasmid, and probed with anti-hnRNP R or anti-HA antibodies. GAPDH was probed as loading control. (E, F) Absolute copy numbers of Hnrnpr-FL (E) and Hnrnpr-ΔN (F) mRNA isoforms in tissues from P5 wildtype mice. Exon junction-spanning primers were used to measure isoform expression by qPCR. 7SL was used for normalization. Data are mean ± Standard Deviation (SD) (n = 3 animals). (G) Ratio of Hnrnpr-FL to Hnrnpr-ΔN isoform expression measured by qPCR. Data are mean ± SD (n = 3 animals). Statistical analysis was performed using a one-sample t-test comparing the ratios to a hypothetical mean of 1; *P ≤ 0.05, **P ≤ 0.01. (H) qPCR analysis of Hnrnpr-FL and Hnrnpr-ΔN isoform expression in brains of wildtype mice of different ages. The Gapdh transcript was used for normalization. Data are mean ± SD (n = 3 animals). Statistical analysis was performed using two-way ANOVA followed by Bonferroni post-hoc test; **P ≤ 0.01.

