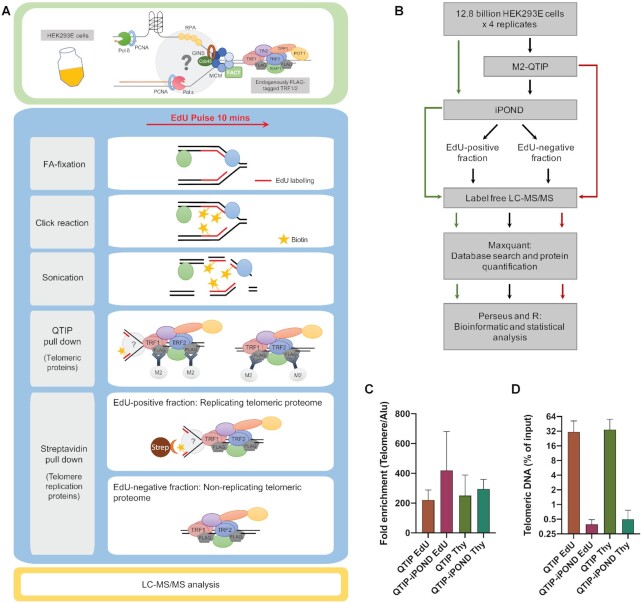
Figure 1.
Experimental scheme of QTIP-iPOND. (A) Upper panel: In the HEK293E cells, TRF1 and TRF2 were endogenously tagged with FLAG-tags. Lower panel: To identify proteins near telomere replication forks, we combined QTIP with iPOND. Upon purification of telomeric chromatin with QTIP, the replicating telomeric proteome was separated from the non-replicating telomeric proteome using streptavidin beads. FA: formaldehyde; Strep: streptavidin. (B) Flow chart of the QTIP-iPOND experiment. 12.8 billion cells were used for each replicate, which was analyzed by QTIP-iPOND (9.6 billion cells for EdU pulse and Thy chase), iPOND (1.6 billion cells for EdU pulse and Thy chase) and QTIP (1.6 billion cells for FLAG-tagged TRF1/2 HEK293E and non-tagged WT HEK293E). (C) Telomeric DNA recovery. The data was obtained by dot blot of three biological replicates. (D) Fold enrichment of telomeric DNA over Alu element. The data was obtained by dot blot of three biological replicates. Data are represented as mean + standard deviation.

