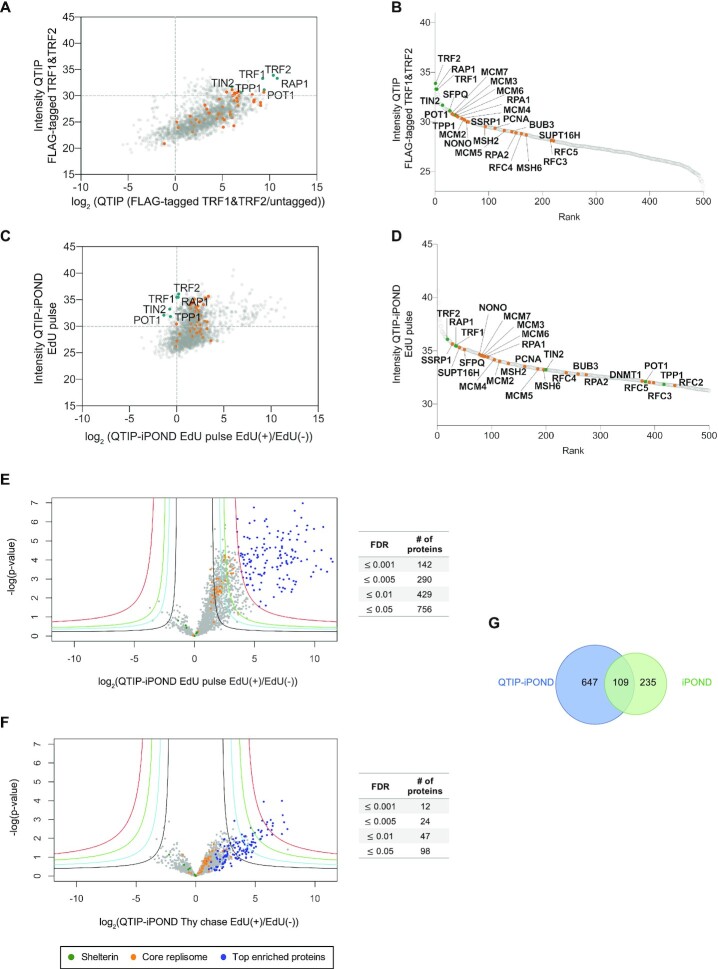
Figure 2.
Protein distribution upon QTIP-iPOND. (A) Comparison of enrichment of core replication proteins to shelterin components by QTIP. (B) Rank of 500 top enriched proteins in QTIP EdU pulse samples. (C) Enrichment of core replication proteins with respect to shelterin components upon QTIP-iPOND in EdU pulse EdU(+) samples. (D) Rank of 500 top enriched proteins in QTIP-iPOND EdU pulse EdU(+) samples. Intensity: label-free quantification (LFQ) intensity. (E) Comparison of QTIP-iPOND enriched proteins in EdU(+) versus EdU(−) samples in the EdU pulse experiment. (F) Comparison of QTIP-iPOND enriched proteins in EdU(+) versus EdU(−) samples in the Thy chase experiment. Red curves: FDR = 0.001; green curves: FDR = 0.005; cyan curves: FDR = 0.01; black curves: FDR = 0.05; s0 = 3. (A–F) Orange dots represent core replication proteins; dark green dots represent shelterin components; blue dots represent the 142 top enriched proteins with FDR ≤ 0.001 in QTIP-iPOND EdU pulse samples. (G) Comparison of QTIP-iPOND (756 proteins) and iPOND (344 proteins) EdU pulse enriched proteins.

