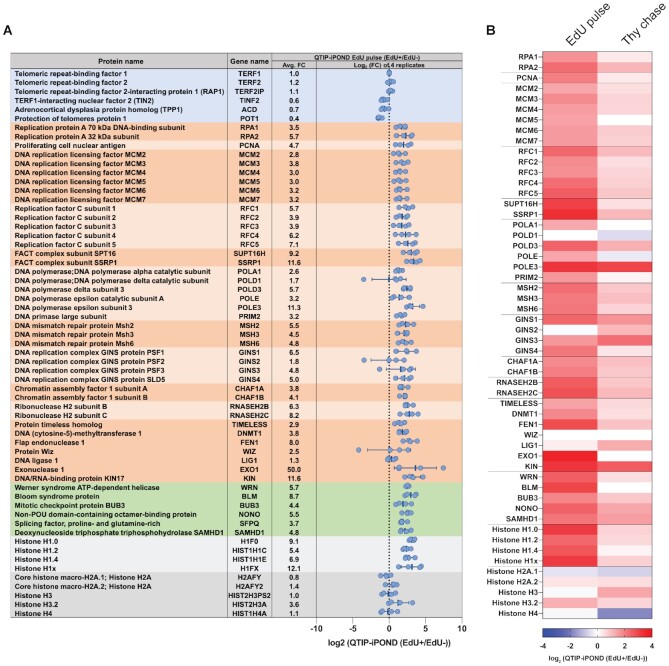
Figure 3.
List of selected proteins identified in the QTIP-iPOND experiments. (A) Proteins in the blue background are shelterin components; proteins in the dark/light orange background are core replication proteins; proteins in the green background are telomere replication proteins; proteins in the dark/light grey background are histones. Each blue dot indicates the log2(EdU(+)/EdU(−)) in one replicate. Avg. FC: the average fold change of EdU(+)/EdU(−). Data are represented as mean ± standard deviation. (B) Heatmap of replication proteins and histones shown in (A) indicating the log2(EdU(+)/EdU(−)) in the QTIP-iPOND EdU pulse and Thy chase.

