Figure 1.
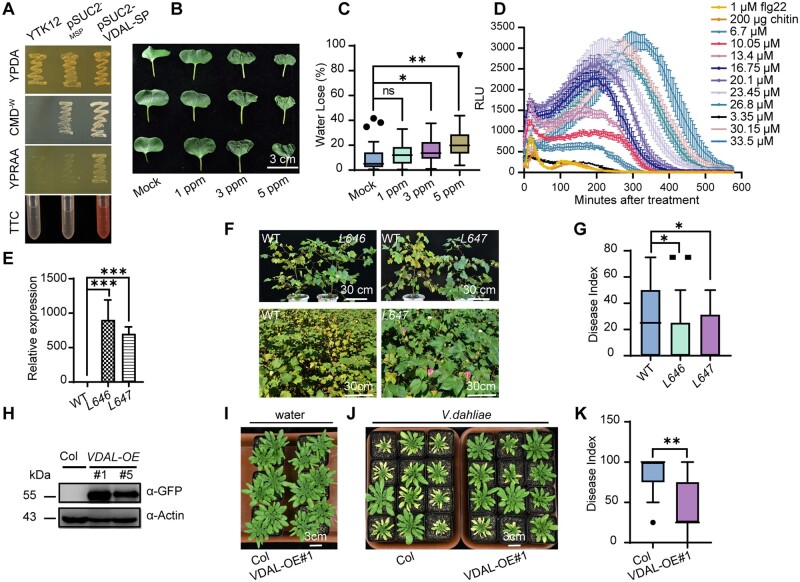
Plants overexpressing VDAL are resistant to Verticillium wilt caused by V. dahliae. A, Test for functionality of the SP of VDAL. CMD−W medium for positive clone screening; YPRAA medium for verification of secretion activity on invertase; TTC assay for the test of secreted invertase activity. Note that only the strain expressing the VDAL SP fusion gained the ability to catabolize raffinose, and reduce TTC into red formazan. Both YPRAA and TTC indicate the successful secretion of the invertase. B, VDAL protein effect on leaf wilt. Petioles were soaked in different concentration of VDAL protein solution for 24 h, and then photos were taken. C, Water loss during leaf wilting. Leaf weight was measured at the beginning and at 12 h after posttreatment. D, Luminol-based assay of ROS burst with increasing concentrations of VDAL protein. Flg22 and chitin were used as positive controls. E, The expression level of VDAL in two corresponding transgenic cotton lines. F and G, Assessment of VDAL transgenic cotton line tolerance to Verticillium wilt caused by V. dahliae in the field. F, Upper: two transgenic lines (L646 and L647) and the wild-type plants were removed from the same field infected with V. dahliae, and replanted in the pots for taking photos; Lower: photos for the wild-type cotton plants and transgenic L647 plants growing in the same field infected with V. dahliae. G, Statistical analysis of the disease index in the above field condition, count with at least 25 plants. H, Immunoblot analysis of VDAL in two transgenic A. thaliana lines overexpressing VDAL. Total proteins of 10-day-old seedlings were extracted and detected with anti-GFP antibodies. Actin was an equal loading control. I–K, Assay of VDAL transgenic Arabidopsis plant resistance to Verticillium wilt caused by V. dahliae. The plants grown in green house for 2 weeks were dipped into the V. dahliae spore suspension or water for 5 min. Photos were taken at 20 dpi. K, Statistical analysis of the disease index of VDAL-oe #1 and Col, count with at least 15 plants. *, **, and *** in (C), (E), (G), and (K) represent significant difference (P < 0.05), highly significant difference (P < 0.01), and extremely significant difference (P < 0.001), respectively, Student’s t- test. The experiments were repeated independently three times with similar results.

