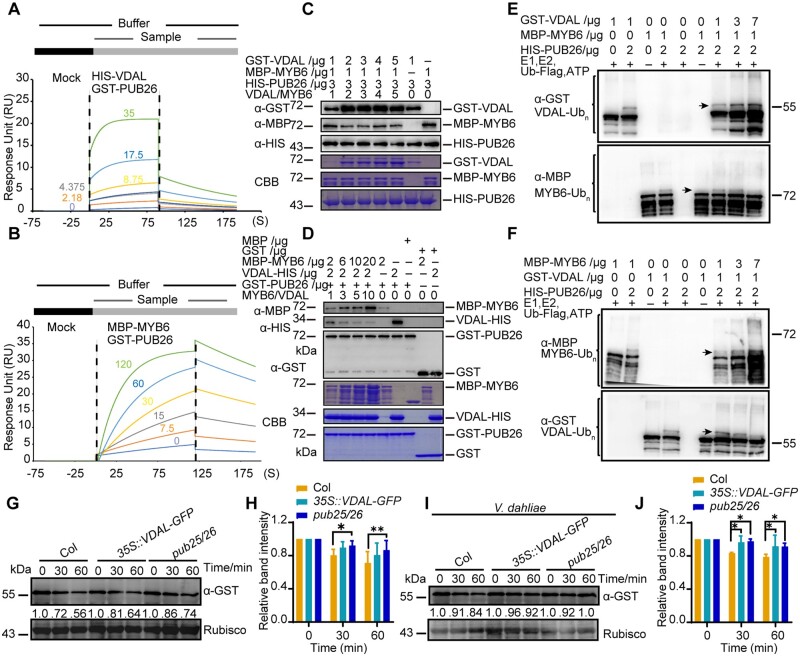
Figure 6.
VDAL and MYB6 are competitive relationships in interacting with PUB26. A and B, Affinity characterization of HIS-VDAL (A) or MBP-MYB6 (B) to GST-PUB26. The anti-GST antibodies were immobilized onto CM5 chip. After baseline was established, the first sample GST-PUB26 injected over the chip was followed by the second sample HIS-VDAL (A) or MBP-MYB6 (B) for certain time with different concentration. The signals generated were subtracted from reference channel and then analyzed with kinetics fitting. The numbers represent the different concentrations (μg mL−1) of the second sample. C, Influence of VDAL on the interaction between PUB26 and MYB6 in the competitive pull-down assay. First, HIS-PUB26 was immunoprecipitated with anti-HIS beads, then GST-VDAL and MBP-MYB6 were added into reaction together with different concentration for 2 h. After fully washing for nonspecific proteins, proteins from beads were detected with anti-GST, anti-HIS, and anti-MBP antibodies. D, MYB6 inhibition of the interaction between PUB26 and VDAL in a competitive pull-down assay. First, GST-PUB26 was immunoprecipitated with anti-GST beads, then VDAL-HIS and MBP-MYB6 were added into reaction with different concentration. Pull-down proteins were detected with anti-GST, anti-HIS, and anti-MBP antibodies. E and F, Competition of VDAL and MYB6 for ubiquitination by PUB26. Different ubiquitination reaction systems with 40 mM ATP composed of different proteins purified from E. coli were incubated at 30°C for 3 h. The ubiquitinated VDAL and MYB6 were detected by anti-GST or anti-MBP antibodies. The total ubiquitination signal was detected with anti-Ub antibodies. G–J, Comparison of MYB6 degradation rate among Col, VDAL-OE, and pub25 pub26 dm. Total proteins extracted from 12-day-old Col, VDAL-OE, and pub25 pub26 seedlings treated with or without V. dahliae for 12 h were incubated with equal GST-MYB6 at 25°C for different times. Immunoblotting analysis was carried out with anti-GST antibodies. Actin was an equal loading control. The relative protein level was quantified with ImageJ. H, It is the relative protein level in (G), (J) is the relative protein level in (I).

