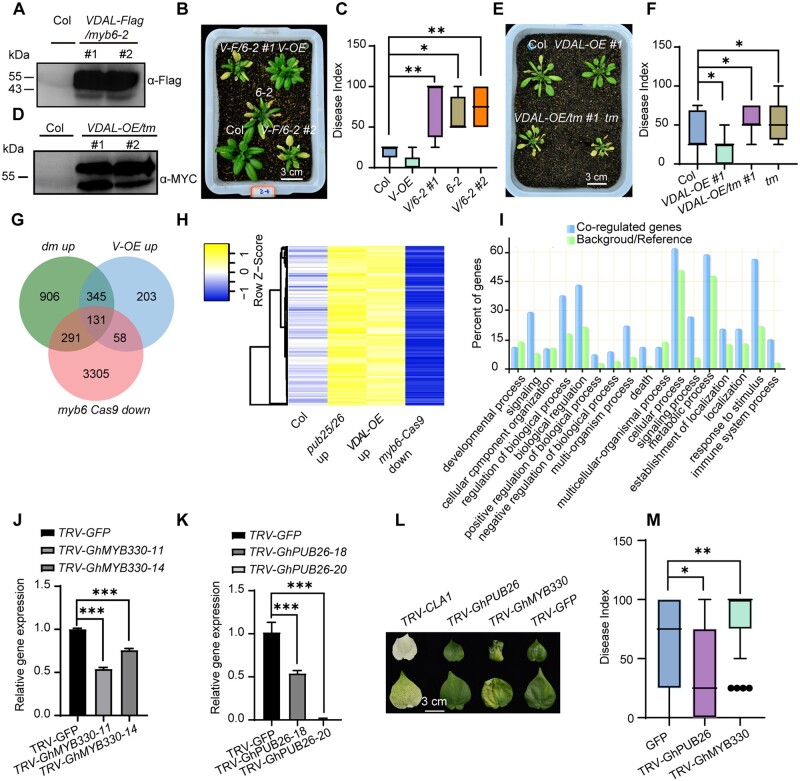
Figure 7.
VDAL competes with MYB6 for PUB25/26-mediated degradation in plants. A, Accumulation of VDAL protein in two myb6-2 transgenic lines. Total proteins extracted from 12-day-old Col and VDAL-Flag/myb6-2 seedlings were detected with anti-Flag antibodies. B, Phenotype comparison of disease symptoms in the wild-type (Col), VDAL overexpression line (Col, V-OE), myb6-2 (6-2), myb6-2 overexpressing VDAL lines 1 and 2 (V/6-2 #1, V/6-2 #2). Photos were taken at 15 dpi. C, Statistical analysis of the disease index of plants indicated in (B), count with at least 15 plants. D, VDAL-MYC overexpression in pub25 pub26 myb6-1 tms. Total proteins extracted from 12-day-old Col and VDAL-MYC/pub25 pub26 myb6-1 seedlings were detected with anti-MYC antibodies. E, Susceptibility of VDAL-OE/tm to V. dahliae compared to that of myb6 and Col. The plants grown in the greenhouse for 2 weeks were dipped into the V. dahliae spore suspension for 5 min. Photos were taken at 20 dpi. F, Statistical analysis of the disease index of plants indicated in (E), count with at least 15 plants. G and H, Transcriptome analysis of the myb6-Cas9, VDAL-OE, and pub25/26 dm by RNA-Seq after treatment with V. dahliae spores (1 × 10⁶ conidia mL−1) for 12 h. (G) Venn diagrams showing the overlapped DEGs (downregulated in myb6 Cas9 and upregulated in pub25 pub26 and VDAL-OE). H, The heat map was drawn according to the expression levels in the myb6-Cas9, VDAL-OE, and pub25/26 in (G). I, Enrichment analysis of overlapping genes among myb6 downregulated and pub25 pub26 and VDAL-OE upregulated genes. J, Relative expression level of GhMYB330 in the VIGS cotton. K, Relative expression level of GhPUB26 in the VIGS cotton. L and M, Influence of knock down of GhMYB330 on cotton susceptibility to V. dahliae and knock down of GhPUB26 on cotton resistance to V. dahliae. The plants grown in the greenhouse for 3 weeks were injected 2 mL V. dahliae spore suspension (1 × 10⁶ conidia mL−1) through stem near cotyledon. Photos were taken at 20 dpi, count with at least 25 plants. * and ** in (C), (F), (J), (K), and (M) represent significant difference (P < 0.05) and highly significant difference (P < 0.01), One-way ANOVA. The experiments were repeated independently three times with similar results.

