Fig. 1.

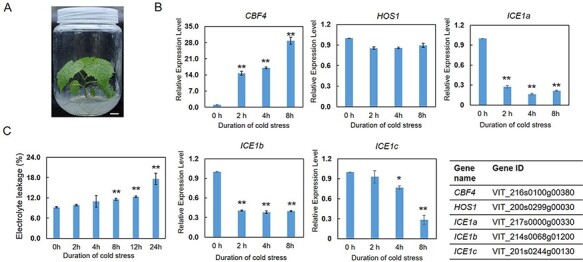
Characterization of gene expression and electrolyte leakage in in vitro Vitis amurensis plants during cold treatment. (A) In vitro V. amurensis plant used for cold treatment. One-month-old plants with uniform growth status were used for cold treatment. Scale bar corresponds to 1 cm. (B) The expression profiles of cold-responsive genes during cold treatment. The relative expression levels of CBF4, HOS1, ICE1a, ICE1b and ICE1c were investigated at 0, 2, 4 and 8 h of cold treatment, respectively, using quantitative real-time PCR (qPCR). The gene IDs are listed in the table. (C) Electrolyte leakage analysis of V. amurensis leaves after cold treatment. Values are means of three replicates ± SD. The test of significance was performed using Student’s t-test. *P < 0.05; **P < 0.01.
