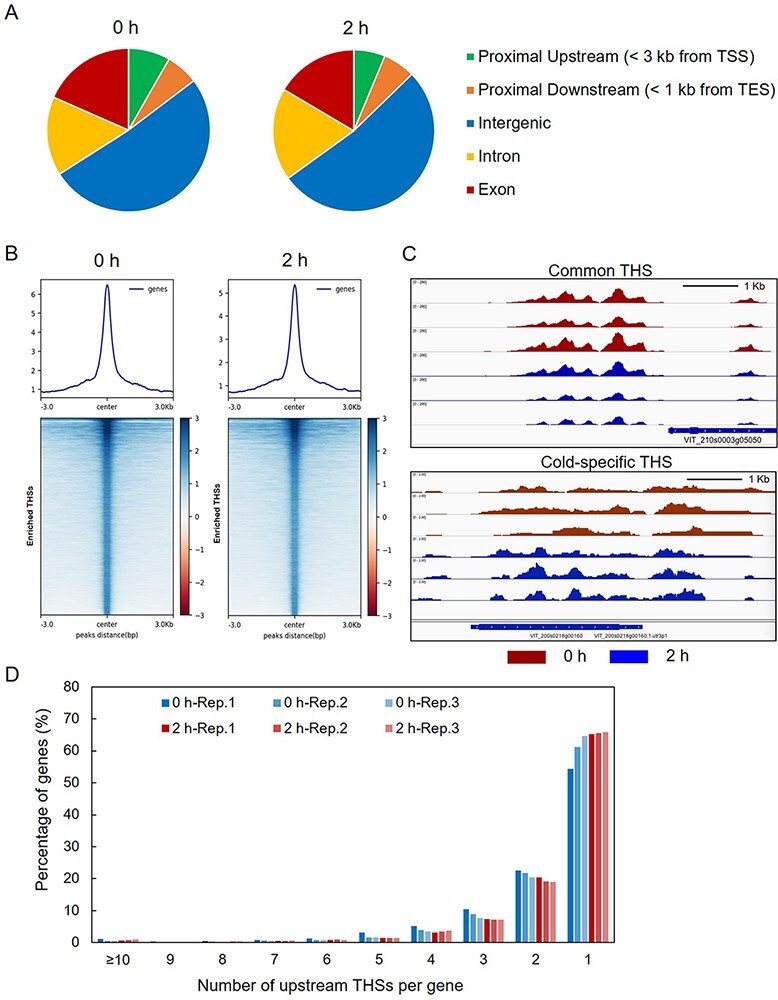
Fig. 2.

Overview of assay for transposase-accessible chromatin (ATAC-seq) data in V. amurensis. (A) Genomic distributions of all the THSs identified in ATAC-seq data. (B) Average plots and heatmaps of ATAC-seq signals of over-enriched THSs at 0 h (left panel) and 2 h (right panel) of cold treatment. (C) Examples of Integrated Genome Viewer (IGV) snapshots of normalized ATAC-seq reads from samples collected at 0 h (red) and 2 h (blue). The common transposase hypersensitive sites (THSs) identified at both 0 h and 2 h (upper) and cold-specific THSs differentially enriched at 2 h (lower) were observed. (D) Number of upstream THSs per gene in V. amurensis. Graph exhibits the percentage of genes with a given number of upstream THSs.
