
Fig. 3.
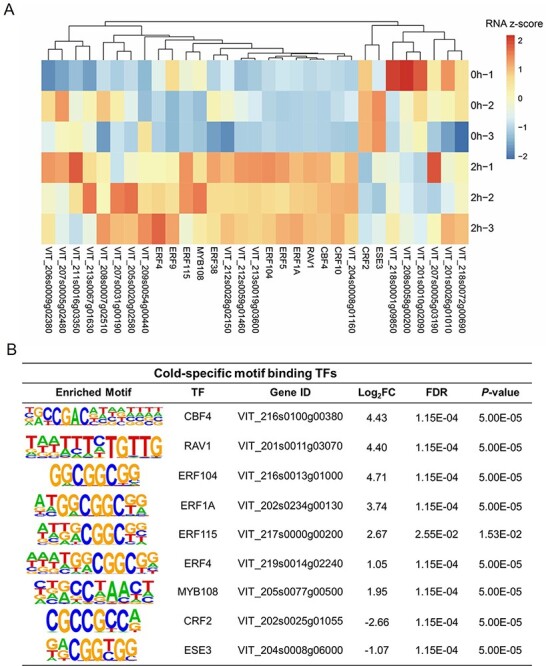
The candidate transcription factors (TFs) in response to cold stress. (A) A heatmap of expression profiles of TF genes after cold treatment. The TFs identified from motif analysis based on the differentially enriched transposase hypersensitive sites after cold treatment were further evaluated according to their expression upon cold treatment. The expression data of TFs genes obtained from RNA-seq were normalized using Z-score. (B) Nine TFs that most likely function in early cold response. The identified motifs, the corresponding TFs and their best matches in grape, log2 fold changes (log2FC) of gene expression, FDR and P values are shown. Only those TFs genes with a log2FC >1 or <−1 and an FDR value <0.05 were retained.