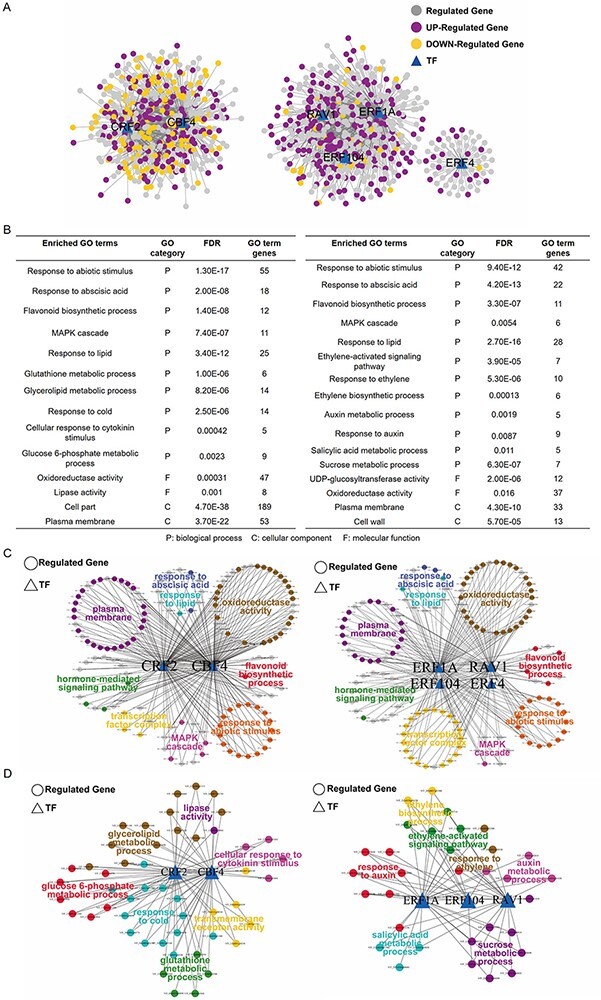
Fig. 4.

Gene ontology (GO) analysis of the enriched transcription factors (TFs) and their target genes. (A) Gene co-expression networks. The six out of the nine TFs shown in Fig. 3B were divided into two independent regulatory networks (CBF4-CRF2 and RAV1-ERFs) using the weighted gene co-expression network analysis (WGCNA). The TFs are indicated by triangles while the target genes are denoted by circles. The differentially expressed genes (DEGs) are indicated in purple (up-regulated) and orange (down-regulated), respectively. (B) Enriched GO terms for the TFs and their target DEGs shown above in (A). Enriched GO terms for the CBF4-CRF2 and RAV1-ERFs networks are shown on the left and right, respectively. (C) The common GO terms shared by the CBF4-CRF2 and RAV1-ERFs networks. The enriched pathways and involved TFs and DEGs are visualized using cytoscape. The genes shared by different pathways are indicated in gray. (D) The specific GO terms identified for CBF4-CRF2 and RAV1-ERFs networks. The enriched pathways and involved TFs and DEGs are shown.
