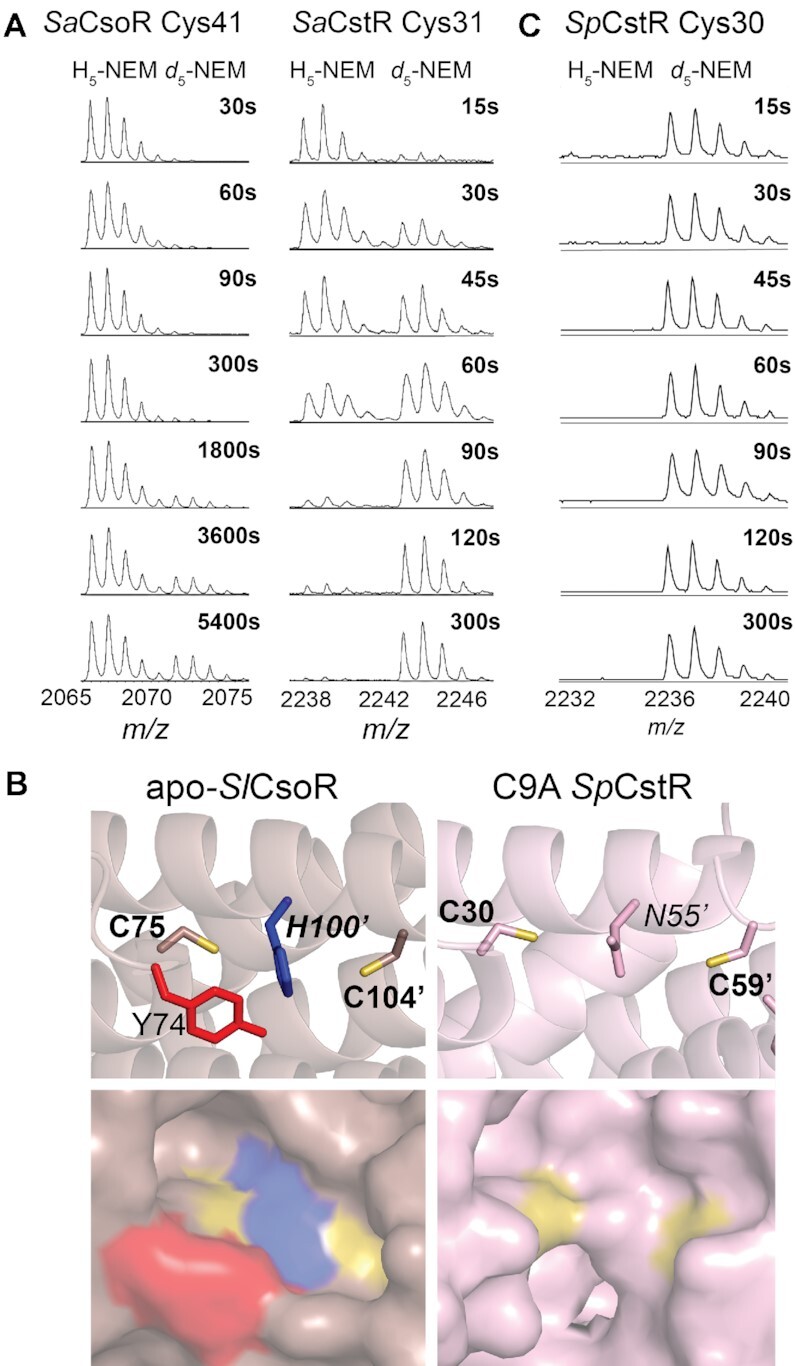
Figure 3.

Selected regions of a series of MALDI-TOF mass spectra obtained by rPA-MS of (A) wild-type SaCsoR (left) and SaCstR (right) showing only the peptide containing the more N-terminal Cys in each case. The d5-NEM pulse time is indicated on each panel, with the H5-NEM and d5-NEM isotopic mass distributions shown, with expected and measured monoisotopic masses (38) shown for each tryptic peptide shown compiled in Supplementary Table S3. Representative MALDI-TOF spectral regions for Cys9, and Cys59 of SpCstR are provided (Supplementary Figure S3). The data in panel were analyzed using single or double exponential model (see Supplementary Figure S3) with the kinetic parameters compiled in Supplementary Table S4. (B) Structures of the dithiol regulatory sites shown for the Cu(I) sensor Streptomyces lividans (Sl) CsoR in the apo-state (33) (left) and the persulfide C9A SpCstR (right) (this work). Residues of interest are shown. (C) Selected region of a series of MALDI-TOF mass spectra obtained by rPA-MS of wild-type SpCstR.
