Figure 5.
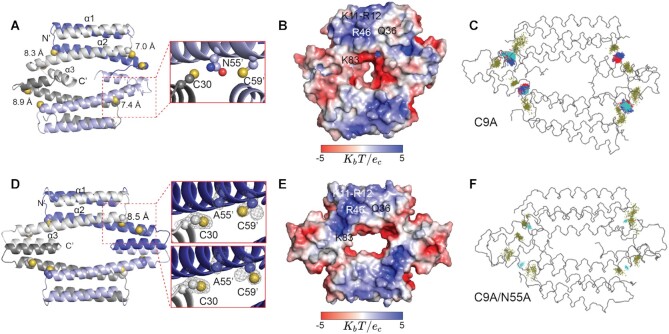
Ribbon and electrostatic surface representations of the crystallographic structures of homotetrameric C9A SpCstR (A, B, respectively) at pH 7.5 and C9A/N55A SpCstR (D, E), at pH 6.0. See Supplementary Table S5 for structure statistics. In panels A and D, each of the protomers are shaded white, blue, grey and light blue. The side chains of C30, N55 (A55) and C59 are presented in sphere representation, with CPK coloring and Sγatoms yellow. Interprotomer C30 Sγ-C59’ Sγ distances are indicated. In C9A/N55A SpCstR, the Sγ atom of C59’ occupies two rotamer positions. (C) and (F), results of molecular dynamics (MD) simulations obtained for C9A SpCstR derived from in silico mutation of C9A/N55A SpCstR to C9A SpCstR as the starting structure (C) or authentic C9A/N55A SpCstR as starting structure (F). The temporal displacements of the Cys side chains (yellow) and N55 (C) or A55 (F) over the course of these simulations are shown.

