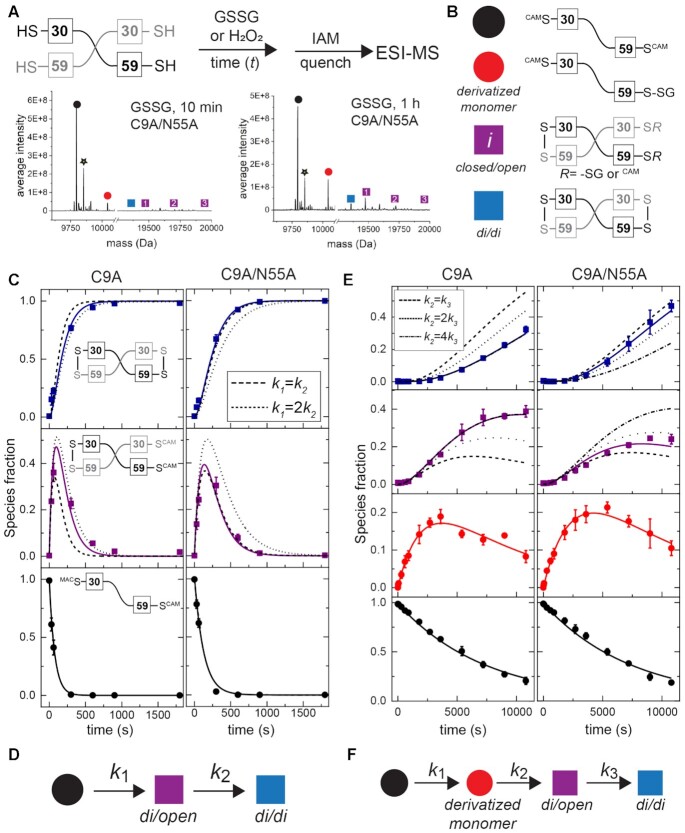
Figure 7.
Thiol reactivity kinetic profiling experiments with non-sulfur-based oxidants, hydrogen peroxide (H2O2) and glutathione disulfide. (A) (top) Overall workflow with a schematic non-covalent ‘dimer’ representation of SpCstR shown with the Cys residues indicated. (bottom) Representative regions of the ESI-MS data obtained for a 10 min (left) or 60 min (right) reaction of GSSG with C9A/N55A SpCstR. The symbols correspond to the state harboring distinct modifications on one or both thiols as shown in panel (B). Supplementary Tables S5-S6 lists expected and observed masses for each of these species. (C) Representative kinetic profiling experiments obtained for C9A SpCstR (left) and C9A/N55A SpCstR (right) and H2O2. (D) Kinetic scheme used to analyze these data with ki compiled in Table 2, and defined by the continuous lines (dashed line, symmetric limit, k1=k2, and dotted line, 2-fold asymmetry, k1= 2k2, in panel (C). (E) Representative kinetic profiling experiments obtained for C9A SpCstR (left) and C9A/N55A SpCstR (right) and GSSG. (F) Kinetic scheme used to analyze these data with ki are compiled in Table 2, and defined by the continuous lines (dashed line, symmetric limit, k1=k2; dotted line, two-fold asymmetry, k1= 2k2, and dashed-dotted line 4-fold asymmetry, k1= 4k2, in panel E.

