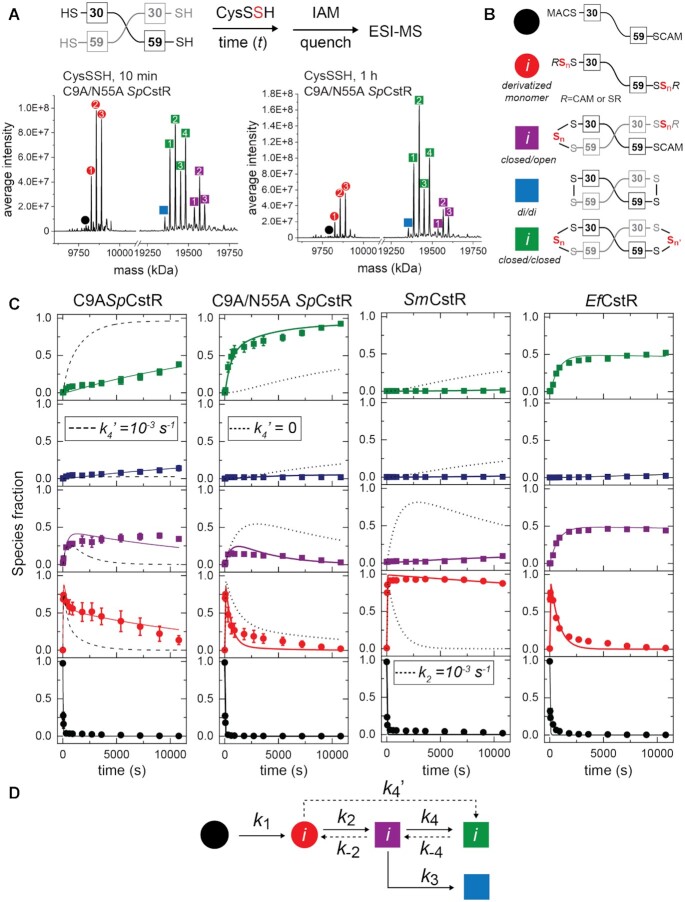
Figure 8.
Cys persulfide (CysSSH) reactivity kinetic profiling experiments with cluster 10 CstRs. (A) Overall workflow. A schematic noncovalent ‘dimer’ representation of SpCstR or SmCstR (one-half of the tetramer) is shown, with the Cys residues indicated. For EfCstR, Cys residues corresponding to C30 and C59 in SpCstR are C32 and C61, respectively. Representative regions of the ESI-MS data obtained for a 10 min (B) or 60 min (C) reaction of CysSSH with C9A/N55A SpCstR. In each case, the monomer region is shown at left, and the crosslinked dimer region is shown at right. The symbols correspond to the generalized structures shown in panel D, with numbers within each symbol corresponding to the ith state harboring n distinct + 32 species distributed among one or both thiols (isomers cannot be resolved using this method): i= 1, n= 1; i= 2, n= 2; i= 3, n= 3; i= 4, n= 4. Supplementary Table S8 lists expected and observed masses for each of these species. (C) Global analysis of these kinetic profiles obtained for C9A SpCstR, C9A/N55A SpCstR, SmCstR and EfCstR (left to right) with CysSSH, using the generalized kinetic scheme in panel D. The species are colored according to the key shown in panel B, with the sum of all ith species grouped into each data point. The continuous lines drawn through each dataset reflect the results of global fitting to the minimal bifurcated model shown in panel D, with individual ki compiled in Table 2. (D) Generalized kinetic scheme used to analyze the reaction profiles obtained with persulfide donors. Continuous lines represent the processes that were determined in all profiles, whereas dashed lines represent the processes that could only be determined for some of the proteins. Rate constants are compiled in Table 2.

