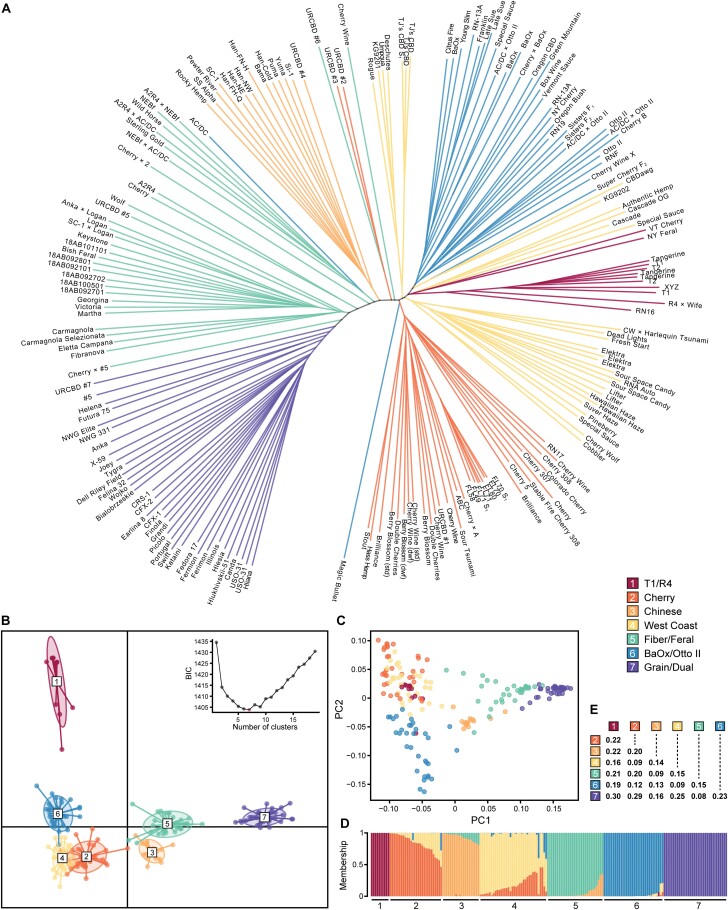
Fig. 1.
Genetic diversity of hemp. Using 190 hemp cultivars, crosses, and feral accessions, panels depict (A) unrooted Neighbor–Joining tree, (B) discriminant analysis of principal components (DAPC), (C) principal component analysis, (D) membership probability ordered by DAPC cluster and within-cluster membership, and (E) pairwise FST. DAPC clusters 1–7 inferred via the Bayesian information criterion (BIC) (k=1:19) are labeled/colored according to the key.

