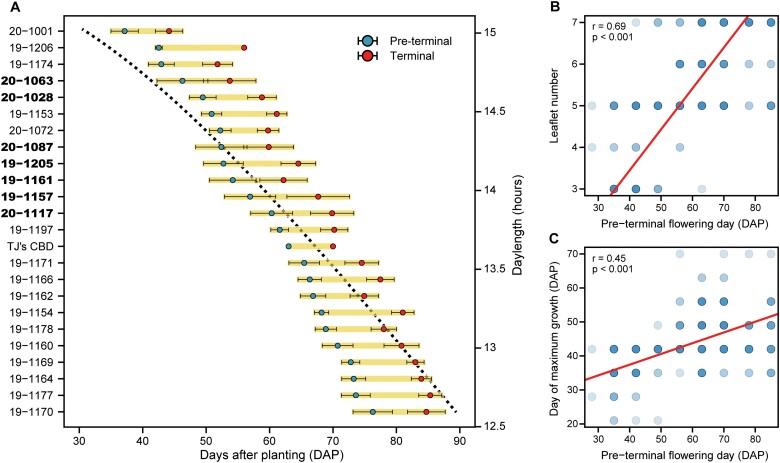
Fig. 2.
Floral phenology. Ordered by mean pre-terminal flowering day, (A) family means (±SE) for pre-terminal (blue points) and terminal (red points) flowering. The black dotted line represents daylength over the same time period on the alternate y-axis. Bold family names represent those families segregating for flowering date. Regression of (B) leaflet number and (C) day of maximum stem growth with pre-terminal flowering day, each represented in days after planting (DAP).

