Fig. 4.
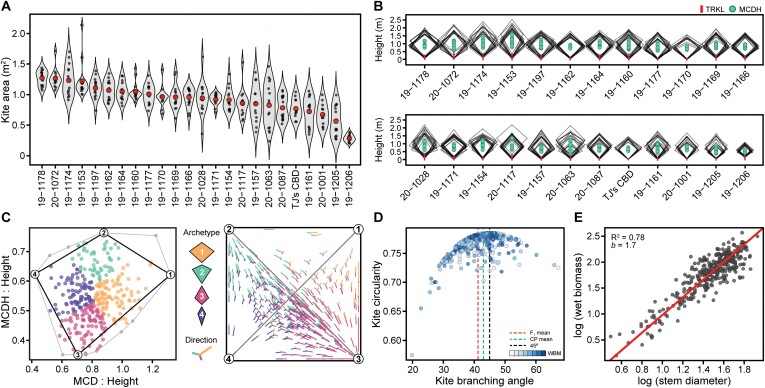
Canopy architecture. Violin plots of (A) kite area (m2) by family and (B) 2-D kite models in descending order. Mean canopy diameter height (MCDH) within 2-D kites is represented by filled circles, and maximum trunk length (TRKL) by red lines. Axes of 2-D kites are 1:1. Archetype analysis (C) using the ratios of maximum canopy diameter (MCD) (x-axis) and maximum canopy diameter height (MCDH) (y-axis) to plant height, and simplex plot showing 2-D-projected direction, with archetypes 1–4 depicted graphically in the key. Scatterplot (D) of kite circularity and kite branch angle (KBA). Mean KBA for all F1 individuals, the common parent (CP), and KBA at maximum circularity (45°), are depicted in red, green, and black hashed lines, respectively. Point color opacity represents biomass accumulation, low to high. Model II linear regression of (E) log-transformed wet biomass and basal stem diameter.

