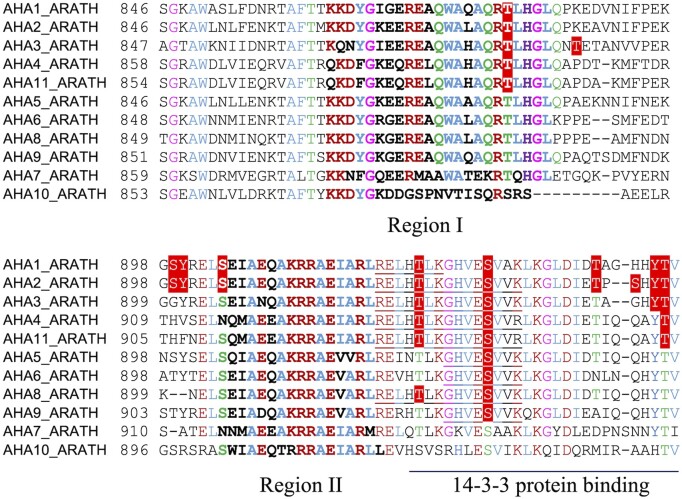
Figure 1.
Phosphosites in the C-terminal regions of AHAs. In vivo phosphosites are highlighted in red boxes with white text. Underlined sequences represent phosphopeptides that cannot be associated with a unique isoform (see Table 1). Residues in the autoinhibitory regions (Regions I and II) are marked in bold. Conserved amino acid residues are colored according to side chain properties (brown, charged; green, polar; blue, hydrophobic; pink, no side chain).

