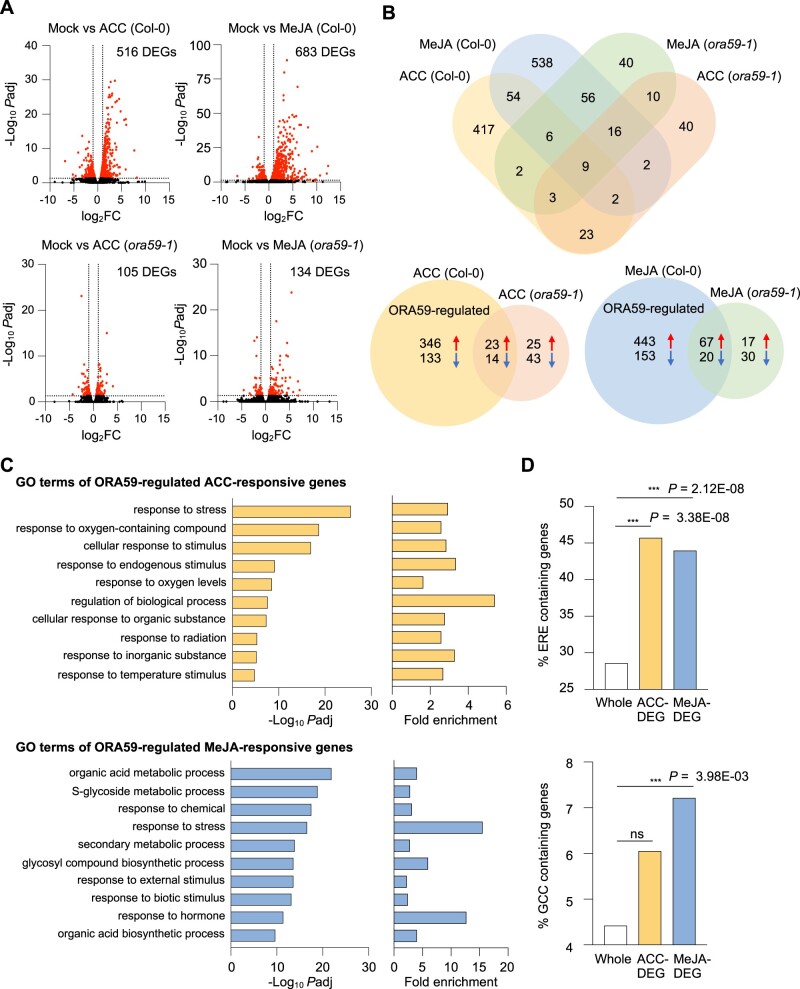
Figure 5.
Identification ORA59-regulated ET- and JA-responsive genes by RNA-seq analysis. A, Volcano plots of DEGs between mock and ACC/MeJA treatments in Col-0 and ora59 plants. Cutoff values (Padj = 0.05 and |log2 FC| = 1) are indicated by dashed lines. The red dots represent significantly upregulated and downregulated DEGs. B, Venn diagrams for DEGs between mock and ACC/MeJA treatments in Col-0 and ora59 plants. C, GO enrichment analysis of ORA59-regulated DEGs. The 10 most significantly (FDR < 0.05) enriched GO terms in the BP are presented for ACC- and MeJA-responsive genes. D, Analysis of the occurrence and enrichment of ERE and GCC box in promoters of ORA59-regulated ACC- and MeJA-responsive genes relative to whole Arabidopsis genes. The occurrence of ERE (AWTTCAAA) and GCC box (GCCGCC) sequences was analyzed using the regulatory sequence analysis tool. Statistical significance of enrichment was determined by Fisher’s exact test (***P < 0.001). Whole, whole Arabidopsis genes; ns, not significant.

