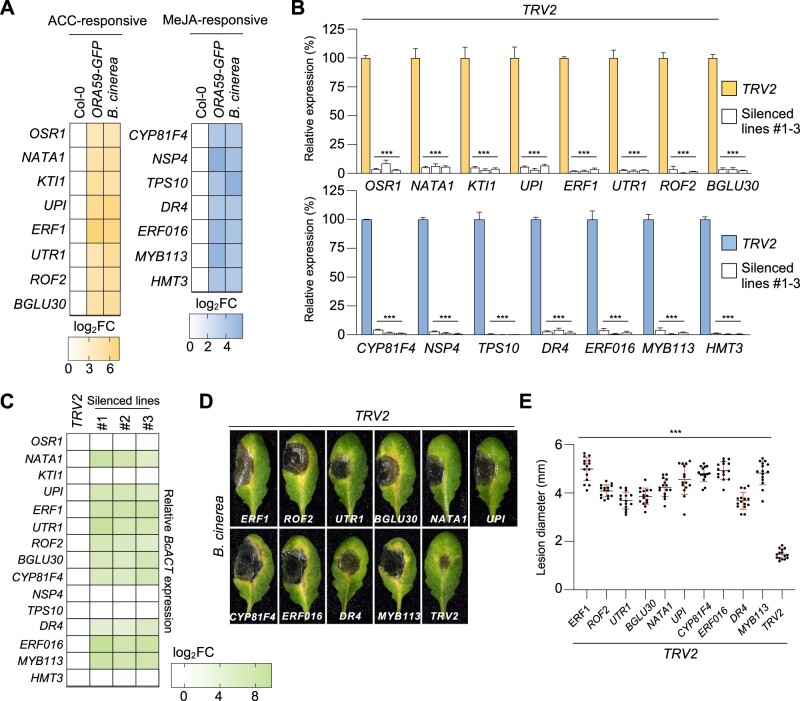
Figure 6.
Identification of immunity-associated ORA59 target genes. A, Heatmap showing the transcriptional levels of the most expressed DEGs in 35S:ORA59-GFP and B. cinerea-treated Col-0 plants relative to Col-0 plants. ACC-responsive eight (|log2 FC| ≥ 4) and MeJA-responsive seven (|log2 FC| ≥ 4) genes were selected for VIGS analysis. B, RT-qPCR analysis of the suppression of selected gene expression by VIGS. The transcript levels of selected genes in VIGS plants were determined relative to TRV2 control plants. Values represent means ± sd (n = 3 biological replicates). C, Heatmap showing the abundance of B. cinerea ACTIN (BcACT) gene relative to Arabidopsis TUBULIN 2 (AtTU2) in B. cinerea-treated TRV2 control and VIGS plants. D and E, Disease symptoms (D) and lesion diameters (E) in B. cinerea-treated TRV2 control and VIGS leaves. Values represent means ± sd (n = 15 infected leaves). In (C–E), TRV2 control and VIGS plants were treated with 5-µL droplets of B. cinerea spore suspensions (5 × 10⁵ spores mL−1) for 2 d. Asterisks indicate significant differences from the TRV2 control (B and E) as determined by one-way ANOVA with Tukey test (***P < 0.001).

