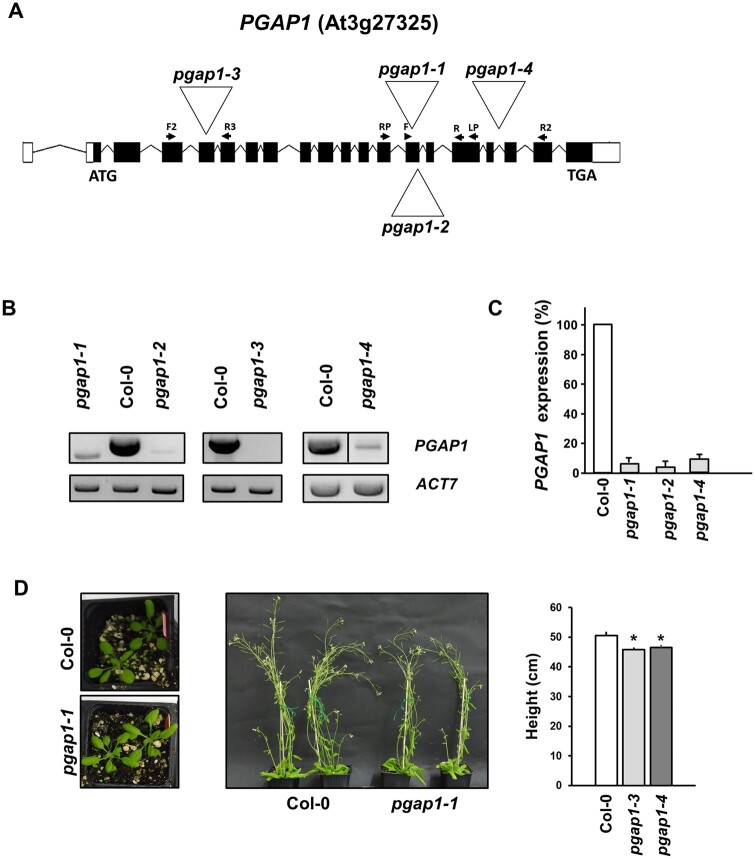
Figure 3.
Characterization of pgap1 mutants. A, Diagram of the PGAP1 gene and localization of the T-DNA insertion (triangle) in the pgap1–1 and pgap1–2, pgap1–3, and pgap1–4 mutants. Black boxes represent coding regions and white boxes represent 5′- and 3′-Untranslated region (UTR) regions and arrows indicate the positions of the primers used for the characterization of the mutants. B, RT-sqPCR analysis of PGAP1 expression in pgap1 mutants. Total RNA from pgap1–1, pgap1–2, pgap1–3, pgap1–4, and wild-type (Col-0) 4-d-old seedlings were used for PCR. PGAP1-specific primers were used (Supplemental Tables S3 and S4). Actin-7 (ACT7) was used as a control. PCR samples were collected at cycle 22 for ACT7 and at cycle 36 for PGAP1. No wild-type PGAP1 band was detected in pgap1–3. C, Quantification of the bands in the experiments shown in B from three biological samples. No band was detected in the pgap1–3 mutant and thus it is not shown in the quantification. Values were normalized against the PGAP1 fragment band intensity in wild-type that was considered to be 100%. Error bars represent standard error of the mean (SEM). D, Left, 20-d-old plants and middle panel, 42-d-old plants of wild-type and the pgap1–1 mutant. In the right, the height of 42-d-old wild-type and pgap1 mutant plants expressed as mean ± sem (n = 4). Data asterisk represents statistic differences based on Student’s t test with P < 0.05.

