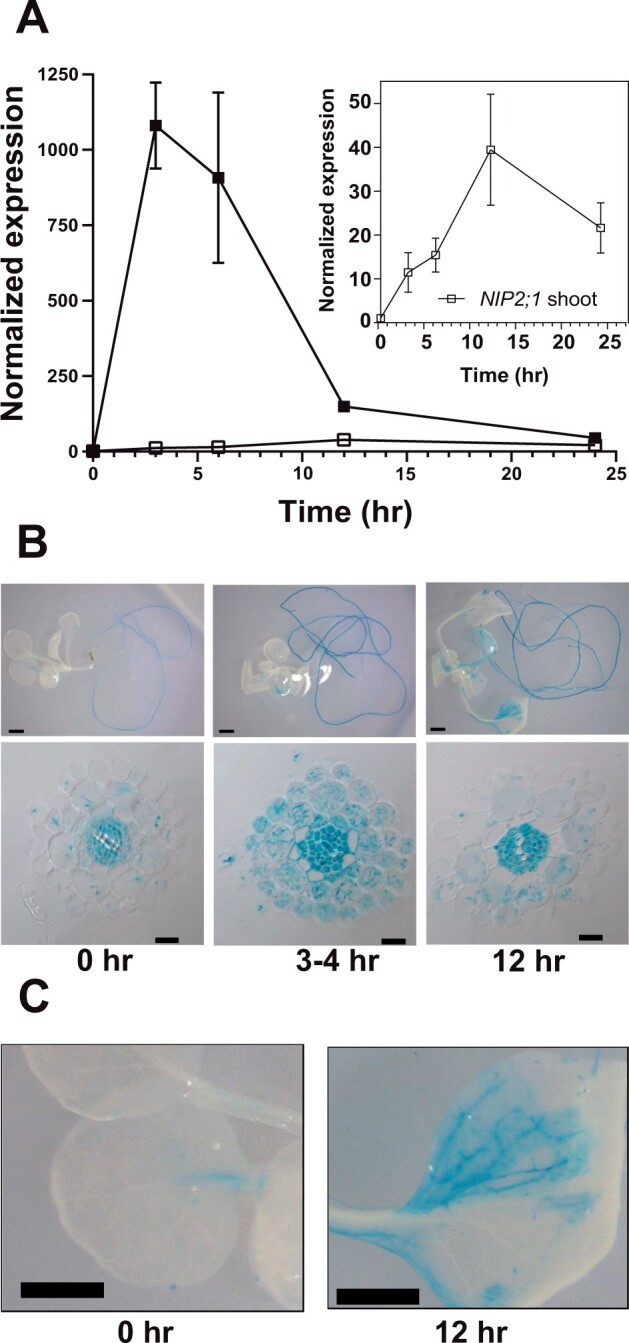
Figure 1.

NIP2;1 expression in Arabidopsis seedlings in response to oxygen deficit. A, RT-qPCR analysis of NIP2;1 transcripts in root (filled squares) and shoot (open squares) tissues during a hypoxia time course of 2-week-old Arabidopsis seedlings. The ΔCt value of NIP2;1 obtained from the 0 h shoot sample was used as the calibrator for expression level normalization. The graph in the insert shows a rescaled plot of NIP2;1 expression in shoot tissue. Error bars indicate the standard deviation (sd) of three biological experiments with three technical replicates each. B, GUS staining analysis of 2-week-old NIP2;1pro::GUS Arabidopsis seedlings subjected to the oxygen deprivation conditions as for (A). Top part represents whole seedlings while the bottom part shows root cross-sections. Scale bars are 1.0 mm for the top part and 20 μm in the bottom part. C, Close up of GUS-stained leaves from (B). Scale bar = 1.0 mm.
