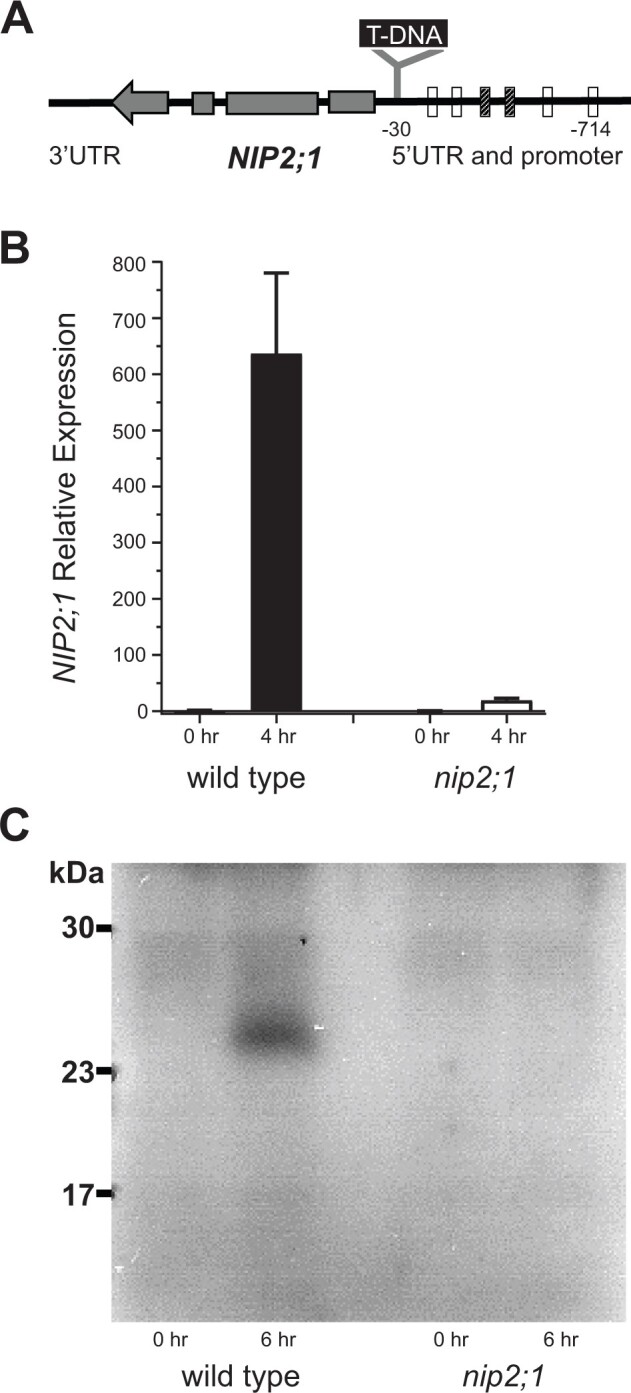
Figure 2.

Characterization of nip2;1 T-DNA insertional mutant seedlings. A, Schematic diagram showing the site of T-DNA insertion in the nip2;1 mutant line. The positions of AREs in the promoter region, based on Olive et al. (1990) (cross hatched bar) or Dolferus et al. (1994) (open bars), relative to the site of T-DNA insertion are shown. The gray bars within the NIP2;1 gene indicate the positions of exons with the arrow indicating the direction of transcription. B, RT-qPCR results for NIP2;1 expression in the roots of 7-d-old WT (Col-0) and nip2;1during hypoxic treatment. The ΔCt value of NIP2;1 expression in normoxic WT roots was used as a calibrator for expression normalization. Error bars show the sd of three biological experiments with three technical replicates each. C, Root extracts (10 μg protein/lane) were analyzed by Western blot with site-directed NIP2;1 antibodies. 0 h, normoxic control; 6 h, 6-h hypoxia-treated seedlings.
