Figure 6.

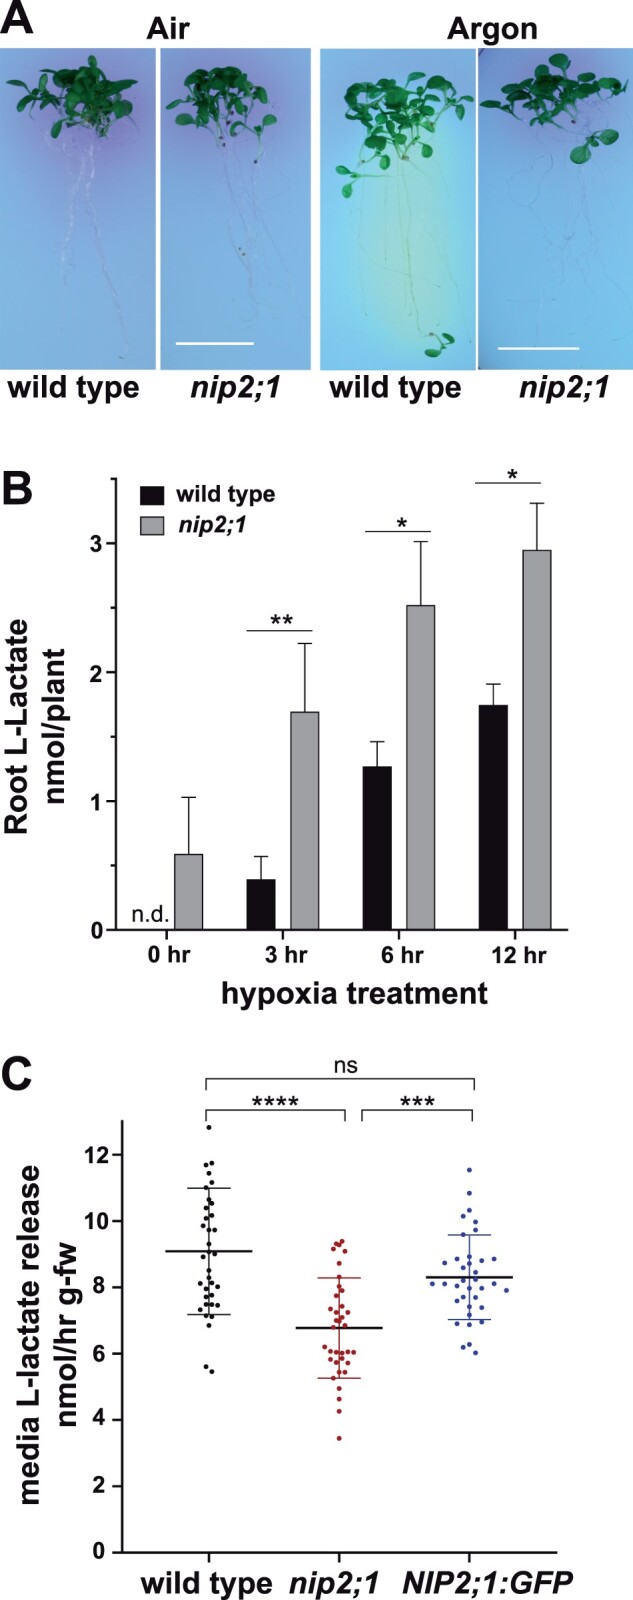
Media acidification and lactic acid efflux in hypoxia-challenged nip2;1. A, Ten-day-old nip2;1 and WT (Col-0) seedlings were transferred to pH indicator plates containing bromocresol purple, and were subjected to 8 h treatment of hypoxia induced by argon gas (Argon). Air indicates a normoxic control. A color change from purple to yellow indicates a decrease in the pH of the environment. Scale bars = 1 cm. B, Quantitation of lactic acid/lactate in seedling roots based on enzymatic analysis during hypoxia. Values are the average from three biological experiments at each time point, with the error bars showing the sd. C, The rate of media lactic acid/lactate release from the seedlings of indicated lines during a hypoxia time course. Each value represents an individual determination from samples taken over an 8-h hypoxia time course, as described in the “Materials and methods,” with the error bars showing the sd. Asterisks in (B) and (C) indicate statistically significant differences based on one-way ANOVA analysis with multiple comparisons (B) or a paired Student’s t test analysis (C). *P < 0.05; **P < 0.01; ***P < 0.001; ****P < 0.0001.
