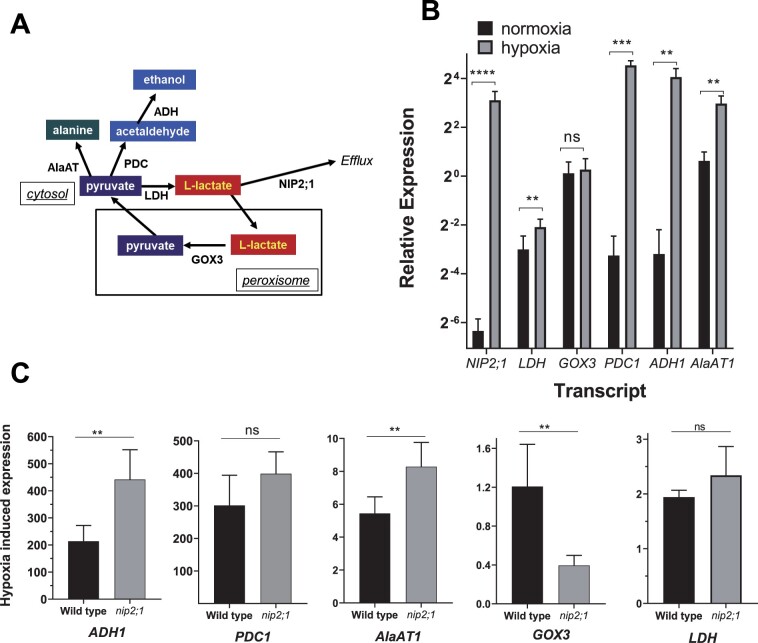
Figure 7.
Comparison of transcripts of lactate and pyruvate metabolic enzymes in hypoxia treated nip2;1 and WT roots. A, Schematic showing the principal pathways of pyruvate and lactate metabolism during fermentation. B, RT-qPCR analysis of the indicated transcripts in the roots of 7-d-old WT seedlings grown under normoxic conditions (black bars) or in response to 4 h of argon-induced hypoxia (gray bars). The data are normalized to the transcript levels of GOX3 under normoxic conditions. C, Comparison of the hypoxia-induced changes of selected transcripts from the roots of WT and nip2;1 seedlings. The data are normalized to the expression levels of the indicated transcript under normoxic conditions. Error bars in (B) and (C) show the sd (three biological experiments each with three technical replicates), and asterisks indicate statistically significant differences based on an unpaired Student’s t test analysis. NS indicates not significant; *P > 0.05; **P < 0.01; ***P < 0.001; ****P < 0.0001.

