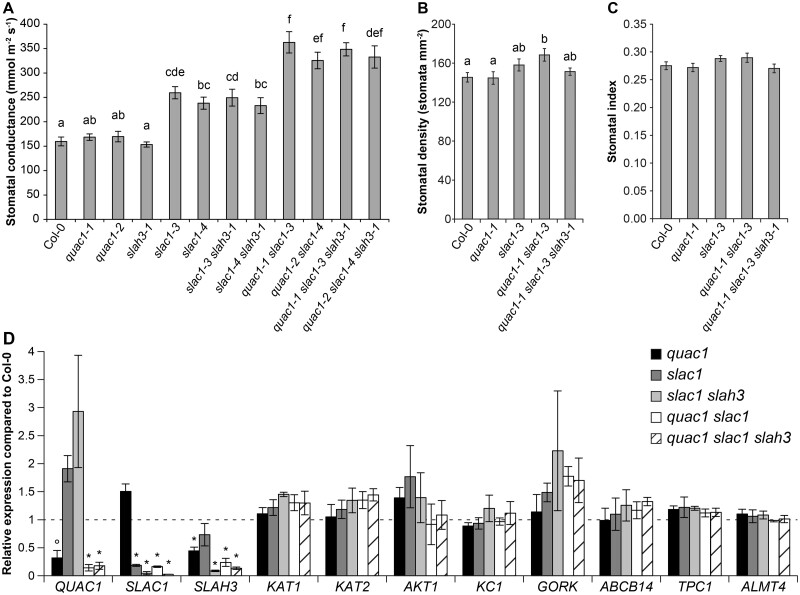
Figure 1.
Stomatal conductance, stomatal density and index, and gene expression in guard cell-enriched samples of Col-0 and anion channel mutants. A, Whole-plant steady-state stomatal conductance (gs) of 3- to 4-week-old plants. Letters denote statistically significant differences between lines (ANOVA with Tukey unequal N honestly significant difference (HSD) post hoc test, P < 0.05; average ± se; n = 7–12). B, Stomatal density of 5-week-old plants. Letters denote statistically significant differences between lines (ANOVA with Tukey post hoc test, P < 0.05; average ± se; n = 19). C, Stomatal index of 5-week-old plants (bars indicate average ± se, n = 19). D, Relative expression of selected marker genes from Col-0 wild-type, quac1, slac1, slac1 slah3, quac1 slac1, and quac1 slac1 slah3 guard cell-enriched samples determined via RT-qPCR and depicted relative to Col-0. The mean of three biological replicates is shown; error bars depict ±se. Statistically significant differences from Col-0 (*P < 0.05; °P < 0.10; ANOVA with Dunnett’s test).

