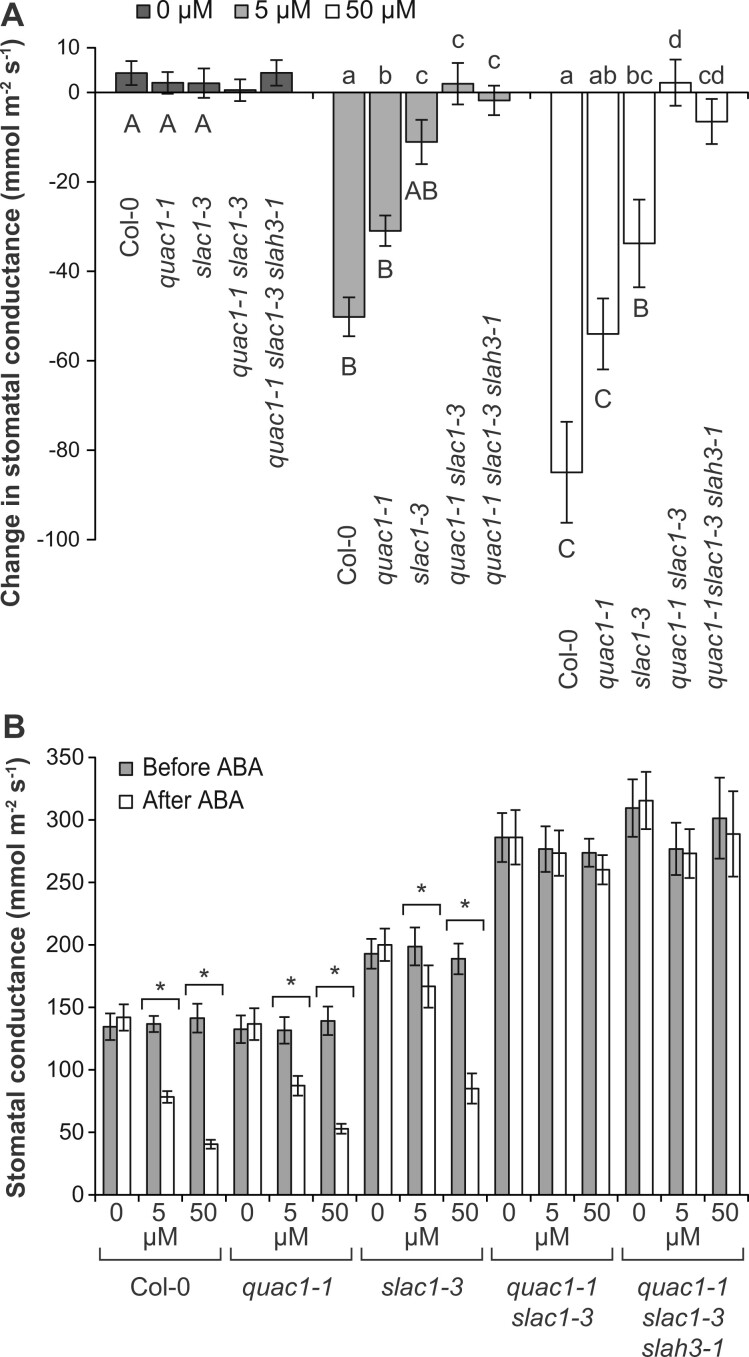
Figure 3.
Stomatal response to foliar ABA spraying (0, 5, or 50 µM). A, Changes in stomatal conductance during the first 16 min. Lowercase letters denote statistically significant differences between lines within the same treatment, capital letters denote statistically significant differences, and no capital letters point at no significant difference between treatments within the genotype (ANOVA with Tukey HSD post hoc test, P < 0.05; average ± se; n = 9). B, Average ± se (n = 9) stomatal conductance before and 56 min after treatment with ABA. Statistically significant differences are denoted by *P < 0.05 between pre- and post-treatment stomatal conductance values (repeated measures ANOVA with Tukey’s post hoc test).

