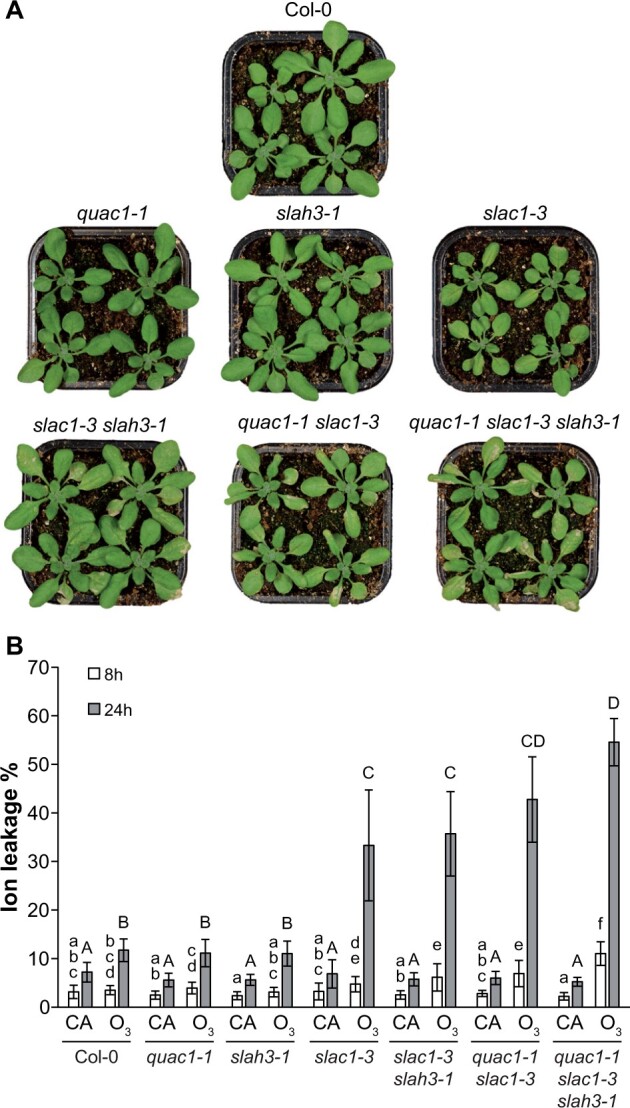
Figure 4.

O3 sensitivity of Col-0 and anion channel mutants. Col-0 and anion channel mutants were exposed to 350 ppb O3 for 6 h. A, Representative photos of studied mutants taken 48 h after the onset of O3 exposure. B, Electrolyte leakage from O3-treated (350 ppb for 6 h) and control (clean air [CA]) plants was measured 8 and 24 h after the onset of exposure and plotted as percent of total ion content. Bars represent means of three biological replicates ±sd (n = 3). Lowercase letters denote statistically significant differences between lines 8 h after the onset of exposure and capital letters denote statistically significant differences between lines 24 h after the onset of exposure (two-way ANOVA genotype × treatment interaction with Tukey’s post hoc test, P < 0.05).
